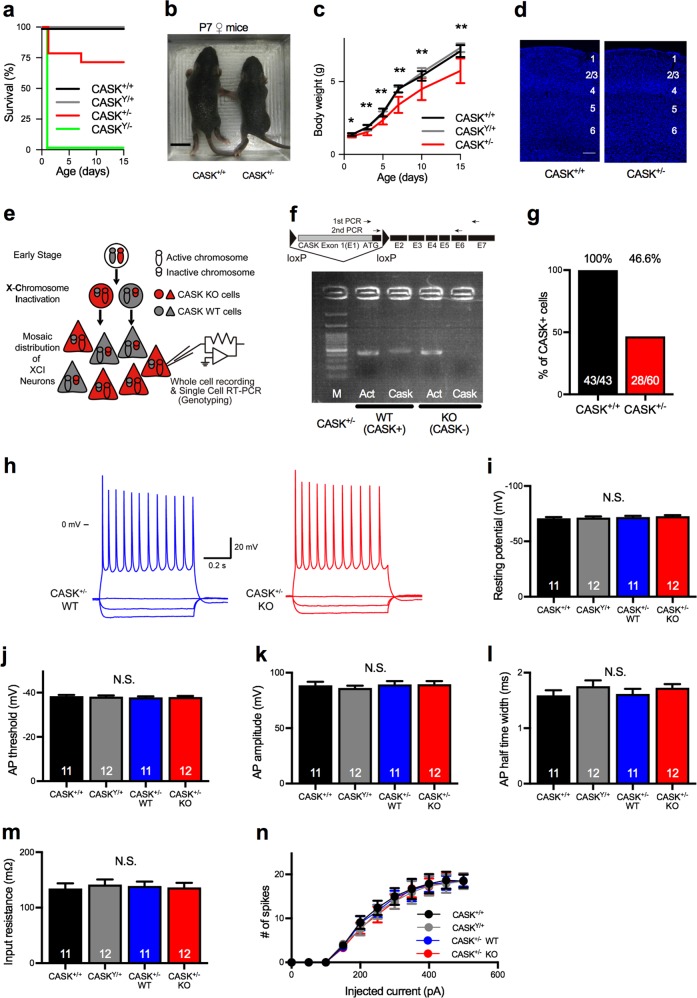
Fig. 1.
CASK is subjected to XCI in female mice. a. Survival rate of CASK-KO and WT mice. Approximately 25% of the CASK+/− mice died within 15 days. Percentage of live animals of each genotype is shown. CASK+/+ (black, n = 12), CASKY/+ (gray, n = 10), CASK+/− (red, n = 14), and CASKY/− (green, n = 10). b Photographs of CASK+/+ (left) and CASK+/− (right) female mice at 7 days of age. The CASK+/− mice were smaller than the CASK+/+ mice. Scale bar represents 1 cm. c Growth curve of CASK-KO and WT mice. CASK+/− mice (n = 10) were smaller than CASK+/+ (n = 10) and CASKY/+ (n = 12) mice. d DAPI staining of the somatosensory cortex of 5-week-old CASK+/+ (left) and CASK+/− (right) mice. Numbers indicate cortical layers. Scale bar: 100 µm. e Schematic illustration of XCI and single-cell genotyping in heterozygous CASK-KO mice. In the progenitor cells of female heterozygous CASK-KO mice, one of the X chromosomes is randomly selected and inactivated by XCI early in development. The XCI pattern is transferred to their daughter cells during cell division, resulting in a mosaic distribution pattern of the CASK WT and CASK-KO cells in tissues. In adult brain slices, the genotypes and physiological functions of neurons were examined by patch-clamp recording followed by single-cell RT-PCR. f Agarose gel electrophoresis image of single-cell RT-PCR. Positions of the primer sets for the RT-PCR of CASK are shown above. Note that the CASK band is absent in the right-most lane (KO; CASK−). M, 100-bp DNA ladder; Act, β-actin PCR product; Cask, CASK PCR product. g Percentage of CASK-positive cells. CASK expression was detected in about half of the cells in the CASK+/− brains. CASK+/+, n = 6 animals; and CASK+/−, n = 10 animals. Numbers on bars are the CASK-positive cells/total cells analyzed. h Representative traces of the membrane potential of CASK-positive (WT, left, blue traces) and CASK-negative (KO, right, red traces) neurons from a CASK+/− mouse. The CASK genotypes of the recorded neurons of CASK+/− mice were determined by single-cell RT-PCR. Scale bars represent 20 mV (vertical axis) and 0.2 s (horizontal axis). 0 mV indicates the potential at the ground. i–n Resting membrane potential (i), AP threshold (j), AP amplitude (k), AP half-time width (l), input resistance (m), and input (injected current)/output (spike number) curve (n) of WT (CASK+/+, CASKY/+, CASK+/− WT) and CASK+/− KO neurons (animal numbers; CASK+/+ female n = 3, CASKY/+ male n = 3, CASK+/− female n = 7). Numbers on bars are the numbers of cells analyzed (i–m). *p < 0.05, **p < 0.01, as examined by ANOVA and Bonferroni’s post hoc test. N.S. not significant

