Fig. 4.
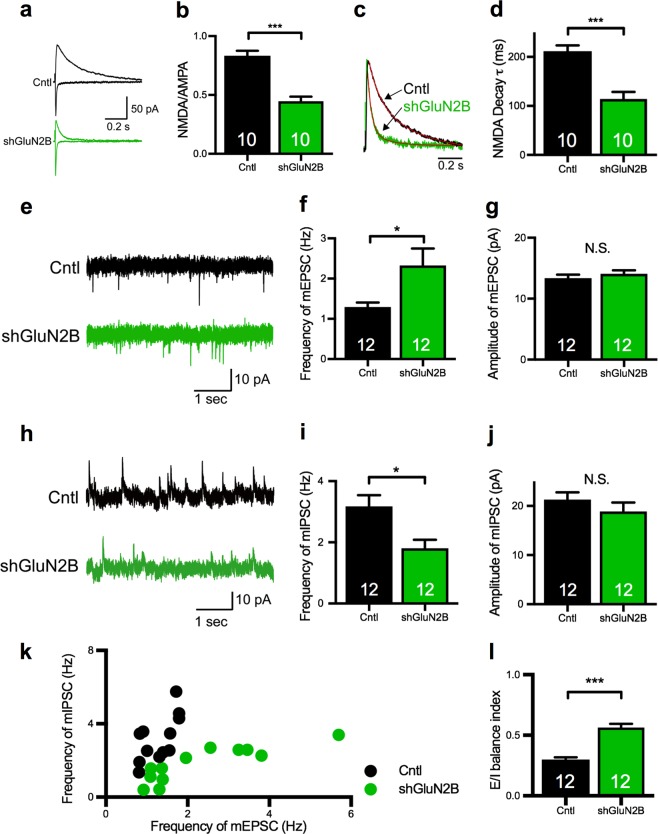
GluN2B-KD disrupts the E/I balance in pyramidal neurons in layer 2/3 of the somatosensory cortex. a Representative traces of evoked AMPA (lower trace) and NMDA (upper trace) receptor-mediated synaptic currents in control (black) and shGluN2B-transfected (green) neurons. Scale bars represent 50pA (vertical axis) and 0.2 s (horizontal axis). b NMDA/AMPA ratio in control and shGluN2B-transfected neurons. The NMDA/AMPA ratio was significantly decreased in the shGluN2B-transfected neurons (animal numbers; Cntl n = 3, shGluN2B n = 3). c Normalized sample traces of NMDA receptor-mediated synaptic currents recorded from control and shGluN2B-transfected neurons. Fitted double exponential curves are shown in red. Scale bar represents 0.2 s. d Weighted decay time constant (τ) of the NMDA receptor-mediated current in control and shGluN2B-transfected neurons. The decay time constant (τ) in shGluN2B-transfected neurons was decreased compared to control neurons (animal numbers; Cntl n = 3, shGluN2B n = 3). e Representative traces of the mEPSC in control (upper) and shGluN2B-transfected (lower) neurons. Scale bars represent 10pA (vertical axis) and 1 s (horizontal axis). f–g Frequency (f) and amplitude (g) of the mEPSC in control and shGluN2B-transfected neurons. The frequency of the mEPSC was increased by GluN2B-KD (animal numbers; Cntl n = 3, shGluN2B n = 3). h Representative traces of the mIPSC in control (upper) and shGluN2B-transfected (lower) neurons. Scale bars represent 10pA (vertical axis) and 1 s (horizontal axis). i–j Frequency (i) and amplitude (j) of the mIPSC in control and shGluN2B-transfected neurons. The frequency of the mIPSC was decreased by GluN2B-KD (animal numbers; Cntl n = 3, shGluN2B n = 3). k Scatter plot of the frequency of mEPSCs versus mIPSCs in control and shGluN2B-transfected neurons. Each dot represents a single cell. The control and shGluN2B-transfected neurons showed different distributions. l E/I balance index of control and shGluN2B-transfected neurons. Statistical significance was determined by unpaired ttest. *p < 0.05, ***p < 0.001. Numbers on bars are the number of cells analyzed. N.S. not significant

