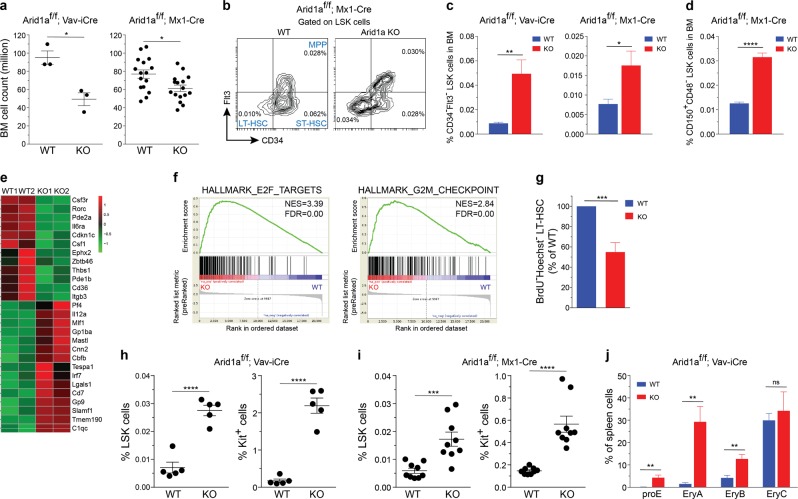
Fig. 2.
ARID1A is required to maintain HSC frequency. a BM cellularity in ARID1A-deficient mice compared with WT mice. Cell counts represent total leukocyte numbers in both femurs and tibias. For Vav-iCre model, mice were euthanized at 11–20 weeks of age; while for Mx1-Cre model, cellularity was determined 4 weeks after injection of poly(I:C). b Representative staining for LT-HSC, ST-HSC and MPP populations using CD34 and Flt3 antibodies in BM of Arid1af/f;Mx1-Cre+ and Arid1af/f;Mx1-Cre– mice, four weeks after poly(I:C) injection. c Proportion of CD34–Flt3– LSK cells in BM of Arid1a deficient and control mice (n = 5 for Vav-iCre; n = 6 for Mx1-Cre). d Percentage of CD150+CD48− LSK cells in BM of Arid1af/f;Mx1-Cre+ and Arid1af/f;Mx1-Cre− mice, four weeks after poly(I:C) injection (n = 4). e Heat map depicts differential expression of known regulators of hematopoiesis affected by loss of ARID1A in LTHSCs (CD34−Flt3− LSK) compared to control (FDR < 0.1, except Cdkn1c, Csf1, Cbfb, where FDR < 0.25). LTHSC were sorted from the BM of Arid1af/f;Mx1-Cre+ and Arid1af/f;Mx1-Cre− mice, 4 weeks after poly(I:C) injection. Genes involved in hematopoiesis were curated manually from Molecular Signatures Database v6.1 and GO datasets from AmiGO 2. f GSEA plots of cell cycle-related gene signatures, HALLMARK_E2F_TARGETS and HALLMARK_G2M_CHECKPOINT, in Arid1a KO vs control LTHSCs. NES: Normalized enrichment score. g Proportion of BrdU−Hoechst33342− LTHSC in the BM of Arid1af/f;Mx1-Cre+ and Arid1af/f;Mx1-Cre− mice (n = 6). Three weeks after administration of poly(I:C), mice were given BrdU in drinking water for one week before they were euthanized for experiment. (h-i) Proportion of LSK and Lin–Kit+ cells in the spleens of WT and Arid1a KO mice in Vav-iCre (h) and Mx1-Cre (i) models. j Frequencies of erythroid precursors in the BM of Arid1af/f;Vav-iCre+ and Arid1af/f;Vav-iCre– mice. (proE: CD71+TER119lo; EryA: CD71+TER119+FSChi; EryB: CD71+TER119+FSClo and EryC: CD71−TER119+FSClo) (n = 5). Data are represented as mean ± SEM. *p < 0.05, **p < 0.01, ***p < 0.001, ****p < 0.0001, ns = not significant

