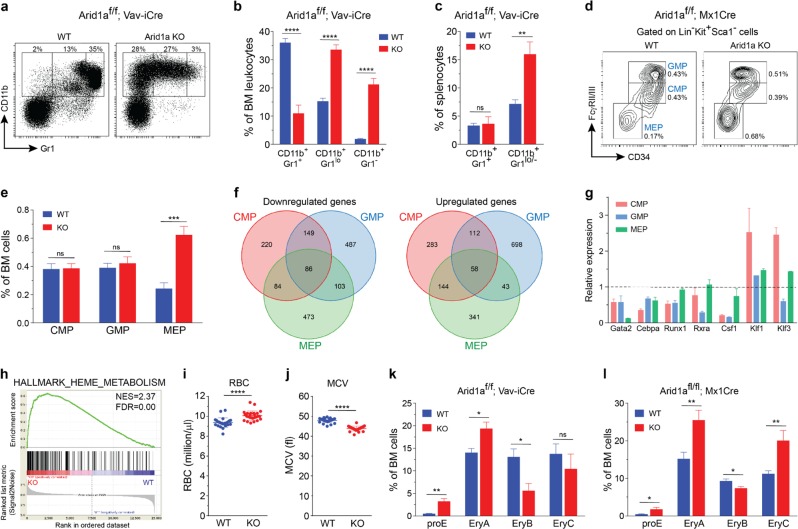
Fig. 3.
Defects in myeloid differentiation in Arid1a knockout mice. a Representative FACS profiles for BM cells from Arid1af/f;Vav-iCre+ and control mice stained with CD11b and Gr1 antibodies. b Frequencies of myeloid populations based on staining for Gr1 and CD11b markers as depicted in (a) (n = 5). c Proportion of CD11b+Gr1+ and CD11b+Gr1lo/− myeloid cells in the spleen of WT and Arid1a KO (Vav-iCre) mice (n = 5). d FACS plots depict representative staining of CMP, GMP and MEP cells in BM of poly(I:C) treated Arid1af/f;Mx1-Cre+ and Arid1af/f;Mx1-Cre− mice. e Percentages of CMP, GMP, and MEP cells in the BM of WT and Arid1a KO (Mx1-Cre) mice (n = 6). f Venn diagrams depict overlap of upregulated and downregulated genes amongst CMP, GMP and MEP cells (FDR < 0.1, mean expression > 1 & absolute log2 fold change > 0.5). RNA-sequencing was performed on cells sorted from Arid1af/f;Mx1-Cre+ and Arid1af/f;Mx1-Cre− mice 4 weeks after poly(I:C) treatment. g Quantitative RT-PCR analysis of selected genes differentially expressed (RNA-seq) in at least one of the three populations (CMP, GMP, and MEP) in the Arid1a KO mice compared with the WT mice. Cells were sorted from Arid1af/f;Mx1-Cre+ and Arid1af/f;Mx1-Cre− mice four weeks after poly(I:C) injection. Bars represent relative expression in Arid1a KO cells compared to WT cells, which were assigned a value of 1 (depicted by a dashed line), for every gene in each cell population. Results are cumulative of two independent experiments. Transcript levels of β-actin were used for normalization. h GSEA plot for geneset HALLMARK_HEME_METABOLISM in the comparison of WT and ARID1A-deficient CMP cells. NES: Normalized enrichment score. i, j Number of RBC (i) and mean corpuscular volume (MCV) (j) in peripheral blood of poly(I:C) treated Arid1af/f;Mx1-Cre+ and Arid1af/f;Mx1-Cre− mice. k, l Frequency of erythroid precursors (proE: CD71+TER119lo; EryA: CD71+TER119+FSChi; EryB: CD71+TER119+FSClo and EryC: CD71−TER119+FSClo) in BM of Arid1af/f;Vav-iCre (k) (n = 5) and Arid1af/f;Mx1-Cre (l) (n = 6) mice. Results represent mean ± SEM. *p < 0.05, **p < 0.01, ***p < 0.001, ****p < 0.0001, ns = not significant

