Fig. 4.
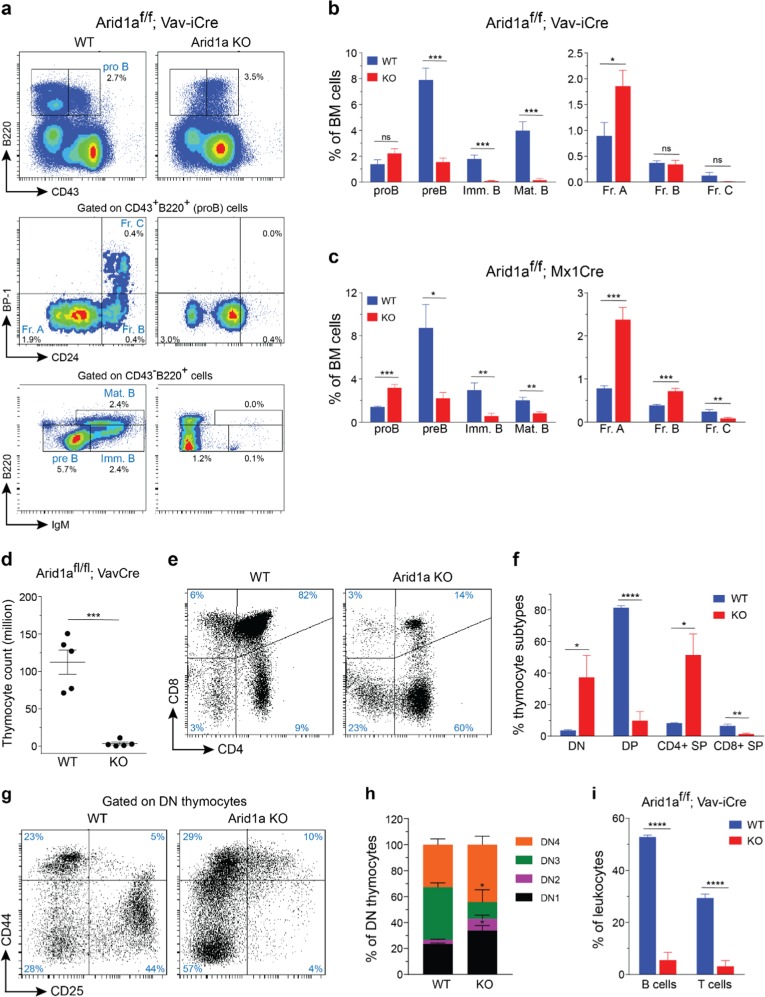
Arid1a knockout impairs lymphoid development. a Representative FACS plots show maturational stages of B cells in the BM of Arid1af/f;Vav-iCre+ and control mice. b, c Proportion of cells in different B-cell developmental stages in the BM of WT and Arid1a KO [Vav-iCre (b) (n = 5) and Mx1-Cre (c) (n = 6)] mice. proB: CD43+B220+, preB: CD43−B220+IgM−, immature B (Imm. B): CD43−B220+IgM+, mature B (Mat. B): CD43−B220hiIgM+, Fraction A (Fr. A): CD24−BP1− proB cells, Fraction B (Fr. B): CD24+BP1− proB cells, Fraction C (Fr. C): CD24+BP1+ proB cells. d Thymus cellularity in Arid1af/f;Vav-iCre+ and control (either Arid1af/f;Vav-iCre− or Arid1af/+;Vav-iCre− littermates) mice (11–20 weeks). e FACS plots depict representative staining of four major thymic populations: DN (CD4−CD8−), DP (CD4+CD8+), CD4+ and CD8+ SP cells in the thymus of Arid1af/f;Vav-iCre+ and control mice. f Frequencies of DP, DN, CD4+ SP and CD8+ SP populations in Arid1af/f;Vav-iCre+ and control mice (n = 5). g Representative flow cytometry staining for CD44 and CD25 expression within the DN population in the thymus of Arid1a KO (Vav-iCre) and control mice. h Proportions of DN1 (CD44+CD25− DN), DN2 (CD44+CD25+ DN), DN3 (CD44−CD25+ DN) and DN4 (CD44−CD25− DN) sub-populations within the DN compartment of thymus of Arid1af/f;Vav-iCre+ and control mice (n = 5). i Frequencies of B cells (CD19+) and T cells (CD3+) in the spleen of WT and Arid1a KO mice (n = 5). Data are represented as mean ± SEM. *p < 0.05, **p < 0.01, ***p < 0.001, ****p < 0.0001, ns = not significant

