Fig. 6.
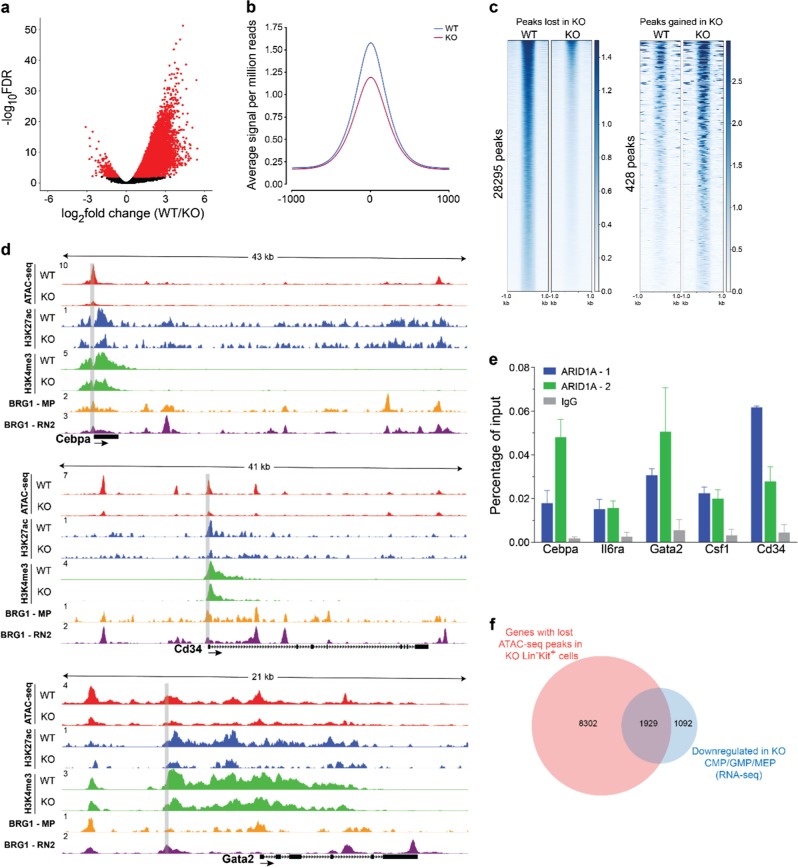
ARID1A maintains chromatin accessibility in hematopoietic cells. a Volcano plot shows ATAC-seq peaks identified in WT and Arid1a KO Lin−Kit+ BM cells. Cells were sorted from Arid1af/f;Mx1-Cre+ and Arid1af/f;Mx1-Cre− mice four weeks after administration of poly(I:C). Peaks enriched significantly in either WT or Arid1a KO cells (FDR < 0.01) are depicted in red. b Average signal for all ATAC-seq peaks. c Heat maps show ATAC-seq peaks (scaled to 1 Kb) identified as either significantly closed (left) or gained (right) in KO cells using DiffBind analysis package. d Representative tracks for ATAC-seq signal (Lin−Kit+ BM cells), H3K27ac and H3K4me3 marks (both Lin− BM cells) and BRG1 ChIP-seq (macrophages (GSM2663828) and RN2 cells (GSM2092897)) at Cebpa, Cd34 and Gata2 loci. Gray rectangles encompass the region analysed for binding of ARID1A using ChIP-qPCR. e ChIP-qPCR analysis of ARID1A occupancy at the loci of Cebpa, Cd34, Il6ra, Csf1 and Gata2 genes in 32D cells using two different ARID1A antibodies (ARID1A-1: Abcam ab182560; ARID1A-2: GeneTex GTX129433). Enrichment was calculated as percentages of input. Error bars represent SEM for two independent ChIP experiments for each locus. f Venn diagram shows overlap of genes with significantly reduced ATAC-seq signal in KO Lin−Kit+ BM cells and genes downregulated in Arid1a KO CMP, GMP, and MEP cells (RNA-seq) compared with the WT cells

