Fig. 1.
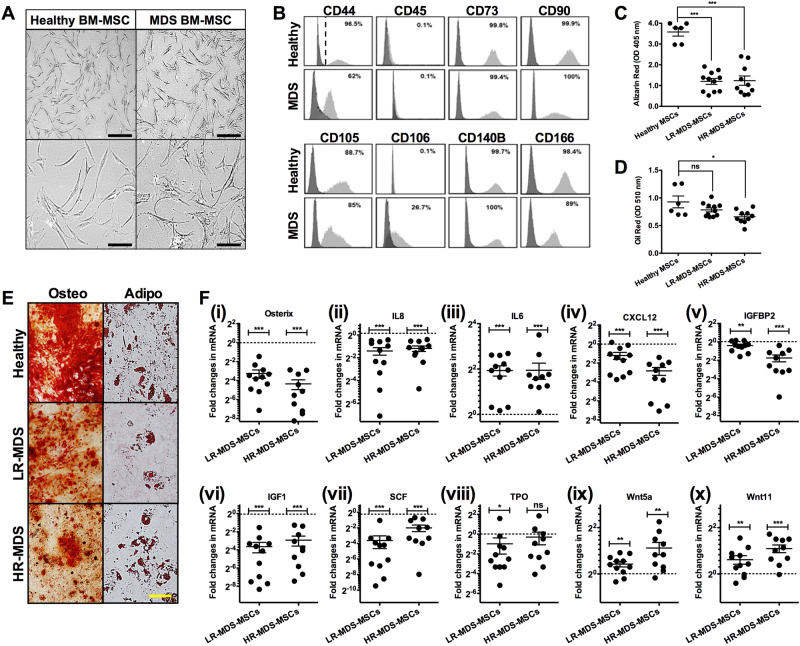
Characteristics of MDS-MSCs. a A comparison of the morphology of healthy and MDS-MSCs. In contrast to healthy MSCs, MDS-MSCs generally have non-spindle shaped morphology. Scale bars = 100 μm (top bars) and 40 μm (bottom bars). b Representative surface immunophenotype analysis of healthy (n = 6) vs MDS-MSCs (n = 21) using flow cytometry which show expression of CD73, CD90, CD105, CD166, CD140B and no expression of CD45 in all samples (healthy or MDS). However, expression of CD44 (n = 21; range 26–90%) and CD106 (n = 21; range: 10–26.7%) was varied across MDS samples. Dark histogram = Isotype control, Gray histogram = respective surface marker. c, d Quantification of osteogenic (c) and adipogenic (d) differentiation potential in MSCs using Alazarin Red and Oil Red, respectively, which is then extracted and spectroscopically measured (See Methods Section). Each data point represents a donor or patient sample. Both LR-MDS-MSCs (n = 11) and HR-MDS-MSCs (n = 10) had significantly reduced osteogenic differentiation potential against healthy MSCs (n = 6 healthy donors shown in graph). Adipogenic differentiation potentials were also reduced but not significantly in LR-MDS-MSCs but significantly in HR-MDS-MSCs. e Representative images of osteogenic and adipogenic differentiation in different MSCs. Scale bar = 40 μm. f (i–viii)) qPCR analysis of MDS-MSCs (HR- and LR-MDS, P1) for expression of genes related to MSC function or hematopoietic support. Each data point represents a patient sample. Compared to healthy MSCs, LR- and HR-MDS-MSCs showed the following fold changes, respectively - Osterix: 0.11 ± 0.03 and 0.05 ± 0.02, IL8: 0.38 ± 0.09 and 0.44 ± 0.07, IL6: 3.82 ± 0.60 and 3.85 ± 1.00, CXCL12: 0.43 ± 0.11 and 0.14 ± 0.04, IGFBP2: 0.76 ± 0.08 and 0.30 ± 0.08, IGF1: 0.08 ± 0.03 and 0.13 ± 0.05, SCF: 0.08 ± 0.04 and 0.25 ± 0.07, TPO: 0.51 ± 0.26 and 0.81 ± 0.34, Wnt5a: 1.40 ± 0.10 and 2.18 ± 0.39, Wnt11: 1.51 ± 0.21 and 2.13 ± 0.24. The expression levels of these genes against each patient sample normalized to a healthy donor controls are given in Supplementary Figure 3. *p < 0.05, **p < 0.01, ***p < 0.001, ns not significant. Non-paired student’s t test was performed. All data represented as mean ± SEM

