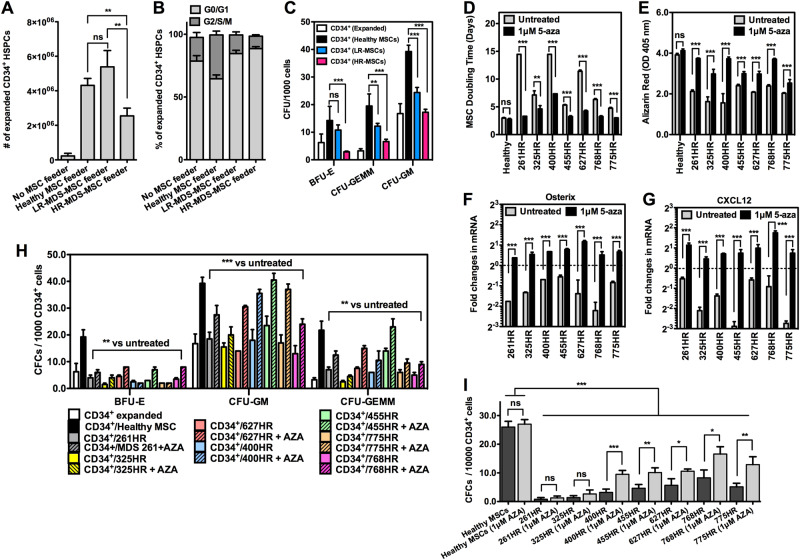
Fig. 3.
Dysplastic MDS-MSCs impairs healthy HSPCs. a There was a significant reduction in the number of CD34+ HSPCs from co-cultures with HR-MDS-MSCs (n = 9, 2.55 ± 0.45 × 10⁶) compared to healthy MSCs (n = 6, 4.31 ± 0.40 × 10⁶, p < 0.01) or LR-MDS-MSCs (n = 8, 5.39 ± 0.95 × 10⁶, p < 0.01) but no significant difference between LR-MDS-MSC and healthy MSC groups. b Cell cycle analysis at day 7 shows the smallest percentage of cycling HSPCs when co-cultured on MDS-MSC stroma, particularly HR-MDS-MSCs. The percentages of cells in G2/S/M are 18.88 ± 3.90, 35.01 ± 3.02, 14.88 ± 2.39 and 9.88 ± 1.92 for no feeder cultures, healthy MSC, LR-MDS-MSC and HR-MDS-MSC co-cultures, respectively. c Hematopoietic CFC potential of healthy CD34+ HSPCs after brief expansion under co-culture conditions with healthy (n = 6), HR-MDS- (n = 8) or LR-MDS-MSCs (n = 8). Attenuation of differentiation potential was most pronounced in HSPCs after co-culture with the HR-MDS-MSC group. Frequencies for CFU-BFU were 2.9 ± 0.3 vs. 14.3 ± 5.1, those for CFU-GM were 17.2 ± 1.2 vs. 39.3 ± 2.3 and those for CFU-GEMM were 6.6 ± 0.9 vs. 19.5 ± 4.4 for the HR-MDS-MSC (n = 9) vs. healthy MSC (n = 6) groups, respectively. Individual CFC counts for each sample are given in Supplementary Figure 5B. These results demonstrate phenotypic changes in HSPCs after exposure to HR-MDS-MSCs. d The average doubling time of MSCs before and after AZA treatments at P0–P1. For healthy MSCs, treatment did not result in appreciable improvements to proliferative capacities (~1.1 fold increase), but for the experimental set of HR-MDS-MSCs (n = 7), treatment resulted in 1.6–4.4 fold increases in the rate of proliferation, p < 0.001. e Quantification of osteogenic differentiation potential in MSCs (P0 - P1) before and after AZA treatments. No significant improvements in osteogenic differentiation potential was observed in healthy treatment MSCs (1.1 fold increase), but 1.2–2.4 fold improvements to osteogenic differentiation potentials were observed in treated HR-MDS-MSCs (n = 7). f, g qPCR analysis of MDS-MSCs (n = 7, P1) for expression of Osterix and CXCL12 before and after AZA treatments. Representative data normalized to a healthy control is shown. After treatment, gene expression of Osterix and CXCL12 significantly increased. Similar trends were observed with IL8 and IGF1 gene expression (Supplementary Figure 6). h Hematopoietic CFC potential of CD34+ HSPCs following co-culture on treated vs untreated HR-MDS-MSCs further showed significant improvements (p < 0.001 or p < 0.01) in the number of CFU-GM (~1.9 × ) and GFU-GEMM (~1.9 × ) compared to co-culture with untreated MDS-MSCs. These data show that hypomethylating drugs such as AZA may also target dysplastic MDS stromal cells and contribute indirectly to the overall restoration of active hematopoiesis. i) The LTC-IC CFC output following a period of co-culture for 5 weeks using different feeder layers. CFCs from all HR-MDS-MSCs (untreated or AZA treated) were significantly lower than healthy co-cultures (p < 0.001). However, AZA treatments of HR-MDS-MSCs were able to partially restore LTC-IC supporting capabilities (p < 0.05), except for 261HR and 325HR (no significant improvements). *p < 0.05, **p < 0.01, ***p < 0.001, ns not significant. Non-paired student’s t test was performed. All data represented as mean ± SEM

