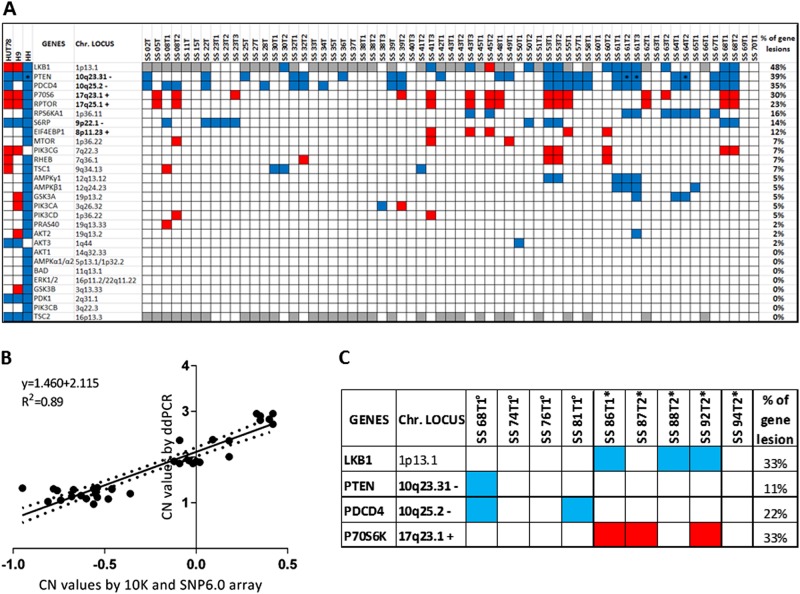
Fig. 4.
Frequency of CN changes of members belonging to PI3K/AKT/mTOR pathway observed in a cohort of 43 SS patients. a CN data were obtained using Affymetrix 10 K and SNP6.0 platforms. Monoallelelic gains and losses are represented in red and blue, respectively. Bi-allelic loss is indicated as*. Genes not covered by 10 K array are represented in gray. Percentages reflect the lesion frequency observed for each gene. b CN values for PDCD4, LKB1 and P70S6K genes obtained by ddPCR versus 10 K/SNP6.0 arrays on a total of 30 samples plus diploid reference gDNA (Affymetrix) used as controls. Graph is based on a linear regression model. Solid line indicates the fitting curve. Dotted line represents 95% confidence limits. P = < 0.0001. c CN values for LKB1, PTEN, PDCD4 and P70S6K obtained by ddPCR on patients analyzed for kinase array validation (°) and mTORC1 in vitro signaling (*). Losses are represented in blue, gains in red

