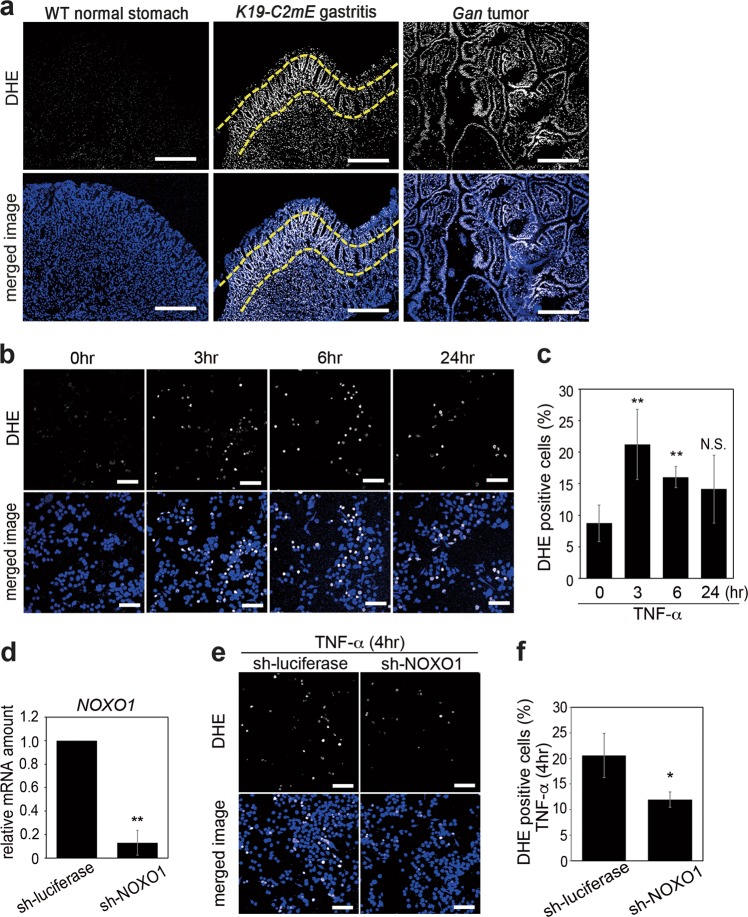
Fig. 3.
The role of NOXO1 in TNF-α-induced ROS production. a Representative photographs of DHE staining (top) and merged images with DAPI staining (bottom) of wild-type mouse stomach (left), K19-C2mE mouse gastritis-associated hyperplasia (center), and Gan mouse gastric tumors (right). Dashed lines indicate the neck region of K19-C2mE hyperplasia. Scale bars, 250 µm. b Representative photographs of DHE staining (top) and merged images with DAPI (bottom) of SNU601 cells at the indicated time after TNF-α stimulation. Scale bars, 100 µm. c The mean ratio of the SNU601 cells positively stained for DHE at the indicated time after TNF-α stimulation (mean ± s.d.). **p < 0.01; N.S. not significant. d The relative mRNA levels of NOXO1 in the sh-NOXO1 lentivirus-infected cells compared to the control SNU601 cells are shown. **p < 0.01. e Representative photographs of DHE staining (top) and merged images with DAPI (bottom) of TNF-α-stimulated sh-NOXO1 lentivirus-infected (right) and TNF-α-stimulated control lentivirus-infected SNU601 cells (left). Scale bars, 100 µm. f The mean ratio of the TNF-α-stimulated sh-NOXO1 and control lentivirus-infected cells positively stained for DHE (mean ± s.d.). *p < 0.05

