Fig. 2.
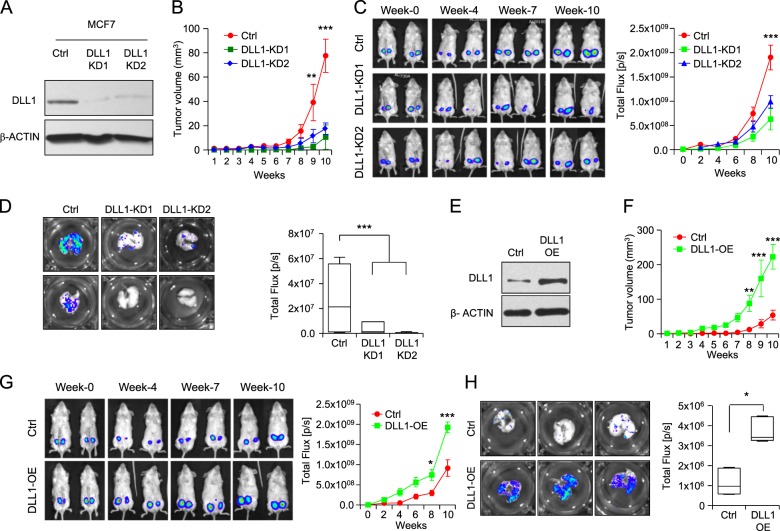
DLL1 promotes human ERα+ luminal tumor growth and metastasis. a Western blot shows DLL1 protein expression in MCF7 control and DLL1-KD (KD1 and KD2) cells after lentiviral shRNA-mediated knockdown (KD). Firefly luciferase-expressing MCF7 control and DLL1-KD (KD1 and KD2) cells (2×10⁶) were injected into mammary fat pad (MFP) of NSG mice. b Tumor growth curves show tumor volume of indicated groups. Representative mice images (c, left) and tumor growth curves (c, right) (total flux, photons per second, p/s) show bioluminescent signal from tumors in vivo. b, c n = 8 tumors/group. Contralateral mammary glands (fourth position) of n = 4 mice were used for injection/group. d Ex vivo lung metastasis images from mice injected with MCF7 control and DLL1-KD (KD1 and KD2) cells using bioluminescence imaging (BLI). d n = 4 mice/group. e Western blot show DLL1 protein expression in MCF7 control and DLL1-OE cells after lentivirus-mediated overexpression (OE) of DLL1. Firefly luciferase-expressing MCF7 control and DLL1-OE cells (2×10⁶) were injected into mammary fat pad (MFP) of NSG mice. f Tumor growth curves show palpated data of tumor volume of indicated groups. Representative mice images (g, left) and tumor growth curves (g, right) (total flux, photons per second, p/s) show bioluminescent signal from tumors in vivo. f, g n = 6 tumors/group. Contralateral mammary glands (fourth position) of n = 3 mice were used for injection/group. h Ex vivo BLI images of lungs from mice injected with MCF7 control and DLL1-OE cells show metastases in indicated groups. n = 3 mice/group. d, h Mann−Whitney U test were used to compute p value. b, c, f, g Two-way ANOVA test with Bonferroni correction was performed to compute statistical significance for tumor growth curve data. Data are presented as the mean ± SEM. *p < 0.05, **p < 0.01 and ***p < 0.001

