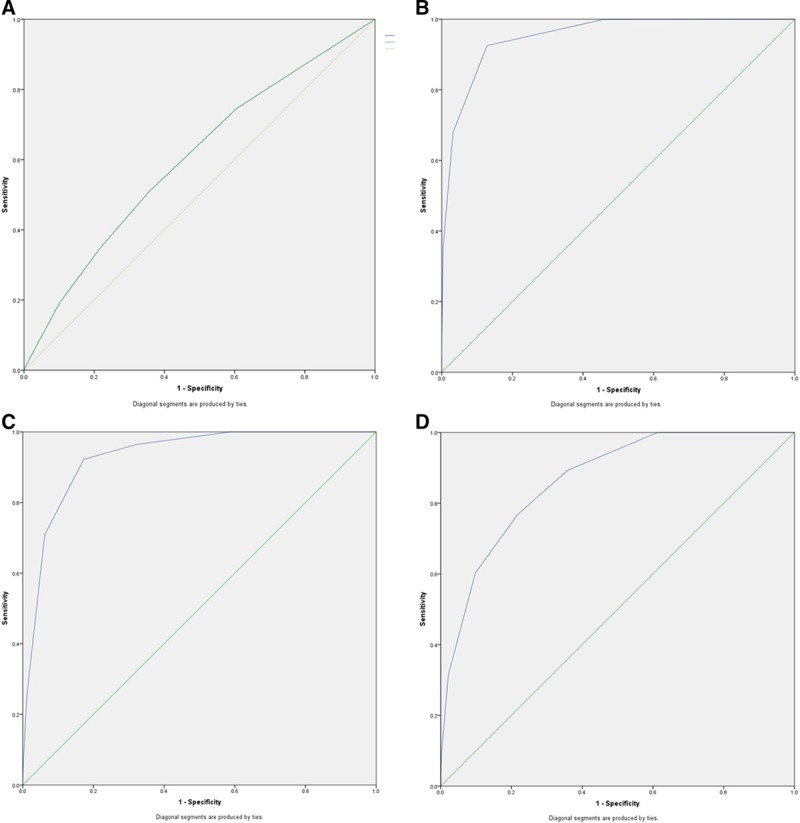
FIGURE 4.

Receiver operating characteristic curves of the model illustrating the discriminating performance of the model to diagnose 90-day mortality of all patients undergoing cadaveric LT (A). B, The area under the curve (AUC) of the model for the prediction of patients with perioperative risk ≥10%, (C) the AUC of the model for the prediction of patients with perioperative risk ≥15%, and (D) the AUC of the model for the prediction of patients with perioperative risk ≥20%. LT, liver transplantation.
