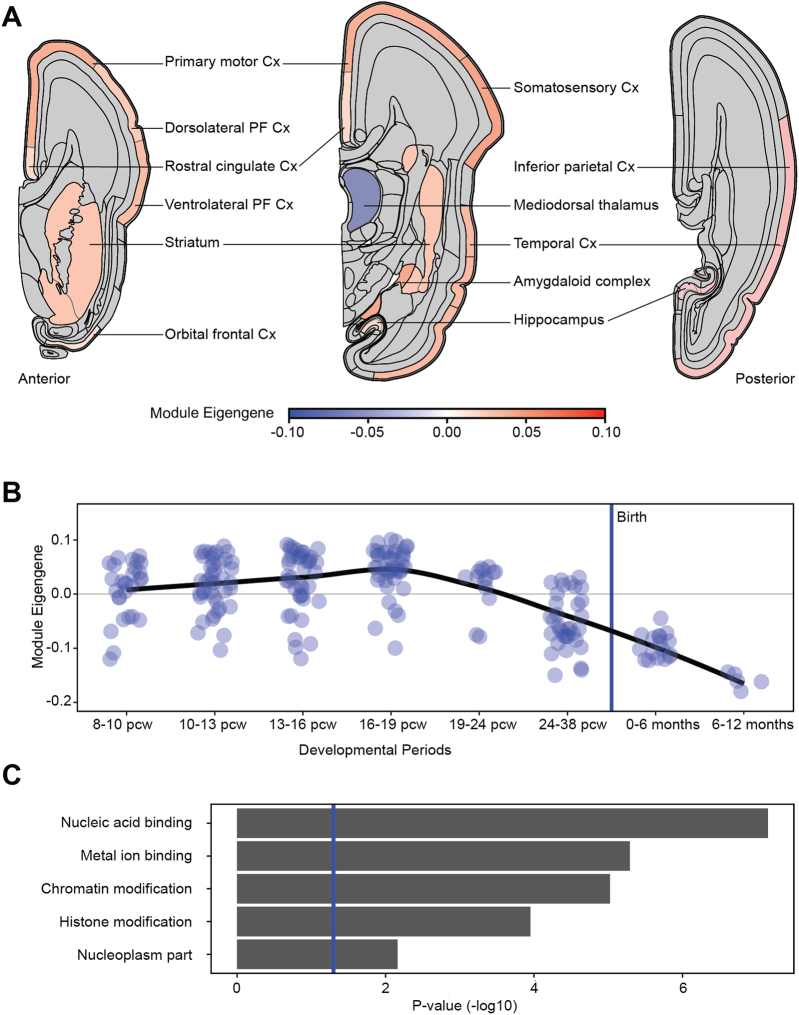
Fig. 3.
Human brain expression pattern and functional enrichment of module M3. a Spatial expression pattern of the CAS-related module at 13–24 weeks post conception, as visualized by the M3 module’s Eigengene. Red shows high expression, blue shows low expression. Multiple samples per region were averaged. No expression data were available for gray regions. b Developmental brain expression pattern of the enriched module during development, as visualized by the module Eigengene. Each dot represents a brain sample, the black line is the loess curve fitted through the data points. The blue vertical line represents time of birth. Pcw: post conception week. c Gene functions enriched in the module identified through gene ontology (GO) term enrichment followed by clustering of GO terms using the functional annotation clustering tool in DAVID. The p values represent the geometric mean of Bonferroni-corrected p values of all GO terms underlying each function. The blue vertical line represents the threshold for significant enrichment (p = 0.05). Cx cortex, PF prefrontal

