Fig. 1.
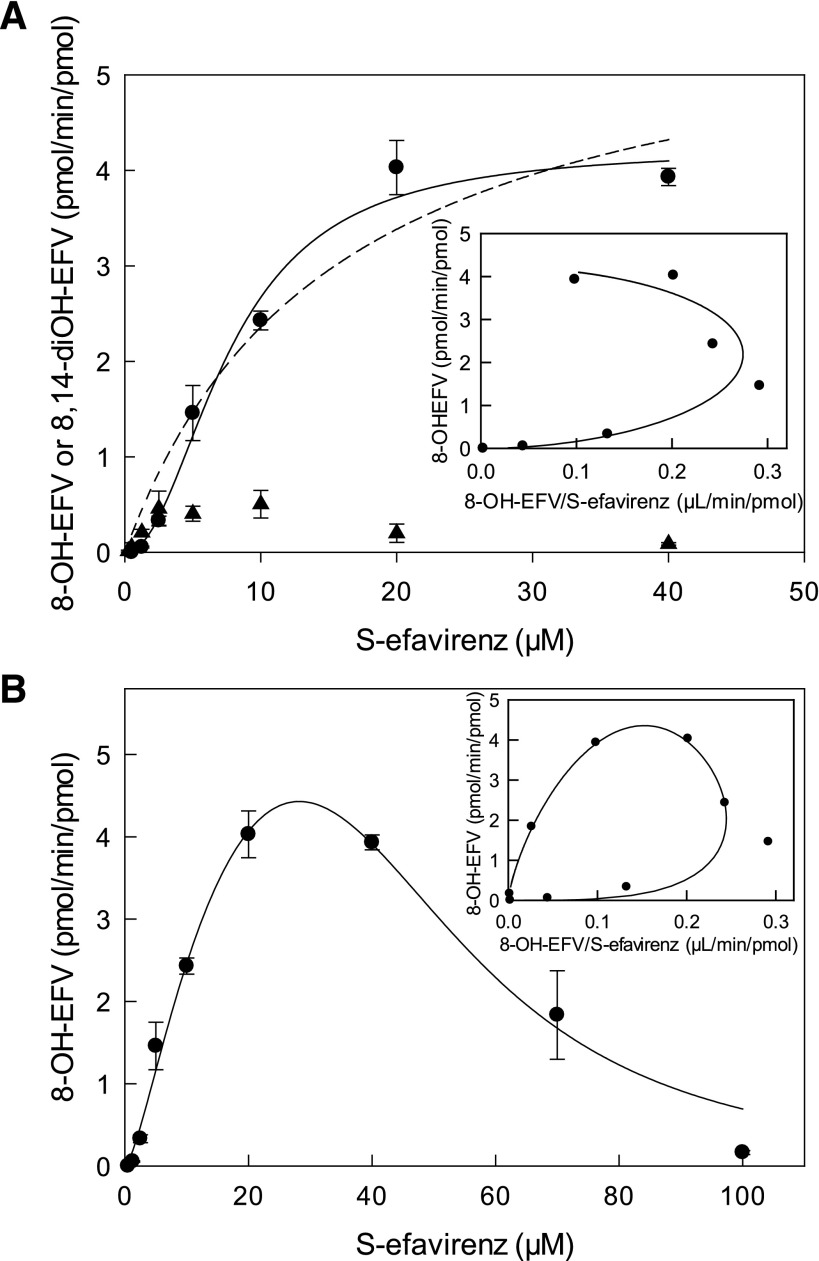
Primary and secondary metabolism of S-efavirenz catalyzed by coexpressed wild-type CYP2B6.1, P450 oxidoreductase, and cytochrome b5. Formation of 8-hydroxyefavirenz (8-OH-EFV) (●) and 8,14-dihydroxyefavirenz (8,14-diOH-EFV) (▲). Results are the mean ± S.D. of triplicate determinations. (A) Metabolism over the substrate range 0.25–40 μM. The solid line represents predicted concentrations on the basis of parameters from nonlinear regression using the Hill equation. The dotted line represents predicted concentrations on the basis of parameters from nonlinear regression using the Michaelis-Menten equation. The inset shows an Eadie-Hofstee plot for 8-hydroxyefavirenz formation. The solid line represents predicted values on the basis of parameters from nonlinear regression using the Hill equation. (B) Metabolism over the substrate range 0.25–100 μM, showing substrate inhibition. The solid line represents predicted concentrations on the basis of parameters from analysis using cooperative substrate binding and substrate inhibition with cooperativity in the inhibitory mode (LiCata model). The inset shows an Eadie-Hofstee plot for 8-hydroxyefavirenz formation. The solid line represents predicted concentrations on the basis of parameters from nonlinear regression using the LiCata model.

