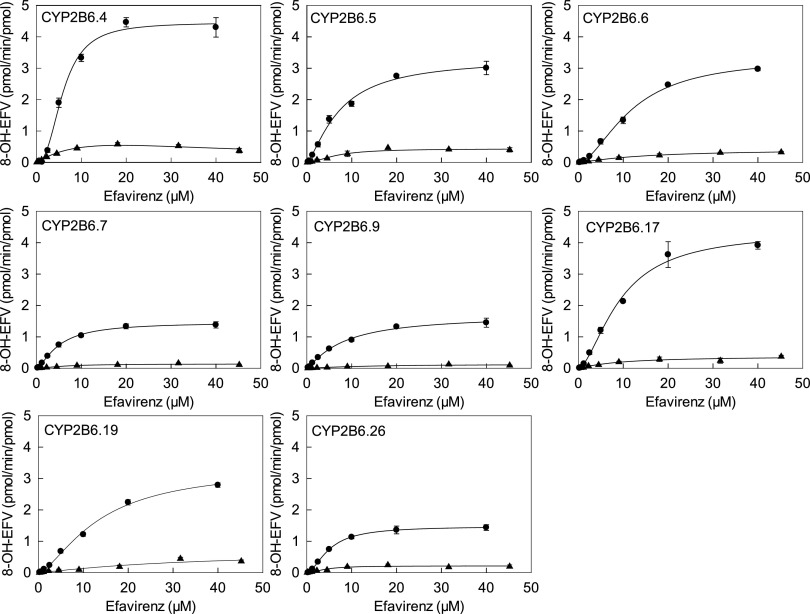
Fig. 3.
8-Hydroxyefavirenz formation from S-efavirenz (●) and R-efavirenz (▲) catalyzed by CYP2B6 variants, POR.1, and cytochrome b5. Solid lines represent predicted concentrations on the basis of parameters from nonlinear regression using the Hill equation. Parameter estimates are in Table 3.

