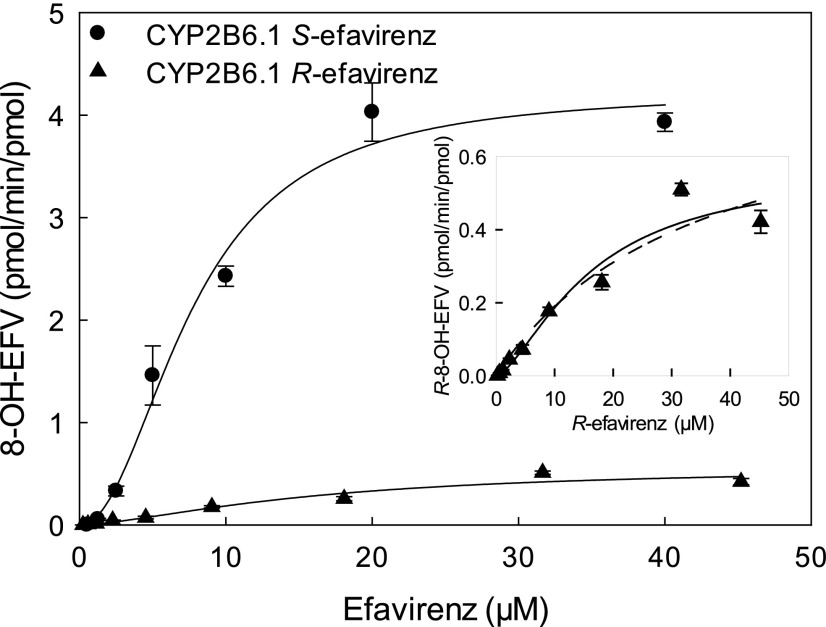
Fig. 5.
Stereoselectivity of efavirenz metabolism. Shown is formation of 8-hydroxyefavirenz from S-efavirenz (●) and R-efavirenz (▲) by CYP2B6.1. The solid line represents predicted concentrations on the basis of parameters from nonlinear regression using the Hill equation for 8-hydroxylation of S-efavirenz and R-efavirenz. The inset compares predicted concentrations for R-efavirenz hydroxylation on the basis of parameters from nonlinear regression using the Hill equation (solid line) and Michaelis-Menten equation (dotted line).

