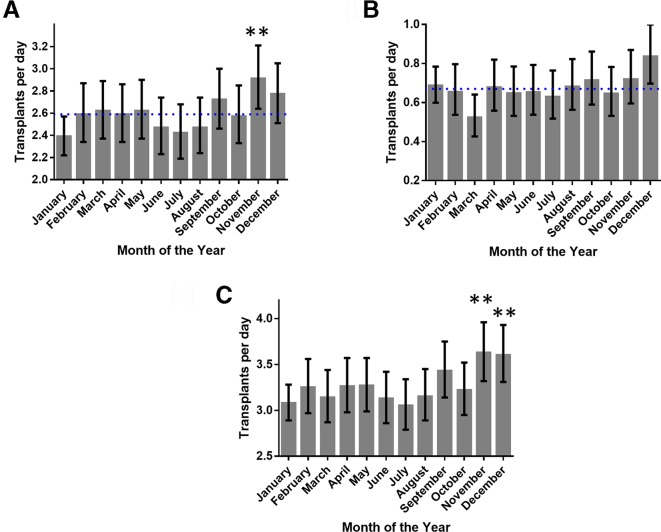
Figure 2.
Changes in transplant activity using donors after cerebrovascular events or hypoxic brain injury. (A) Transplant activity using donors following cerebrovascular events peaks in November. (B) Transplant activity using donors with hypoxic brain damage also increased in activity at the end of the year (November and December). (C) By combining both these causes, the graph mirrors the fluctuation seen in transplant activity for all deceased donors (shown in figure 1C). (*P<0.05, **p<0.01 Pearson residual, dotted line shows average activity).

