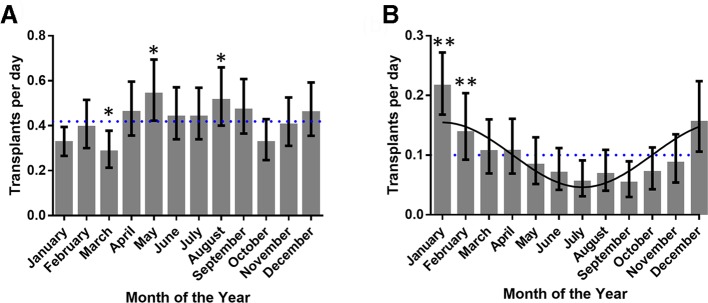
Figure 3.
Seasonal variation in transplant activity arising after infection or trauma. (A) Transplant activity using donors following traumatic incidents increased in the summer (B) as opposed to transplant activity using donors following infection, which oscillated in a sinusoidal manner peaking in the winter. (*P<0.05, **p<0.01 Pearson residual, best fit line for infection is a cosine (p<0.05), dotted line shows average activity).

