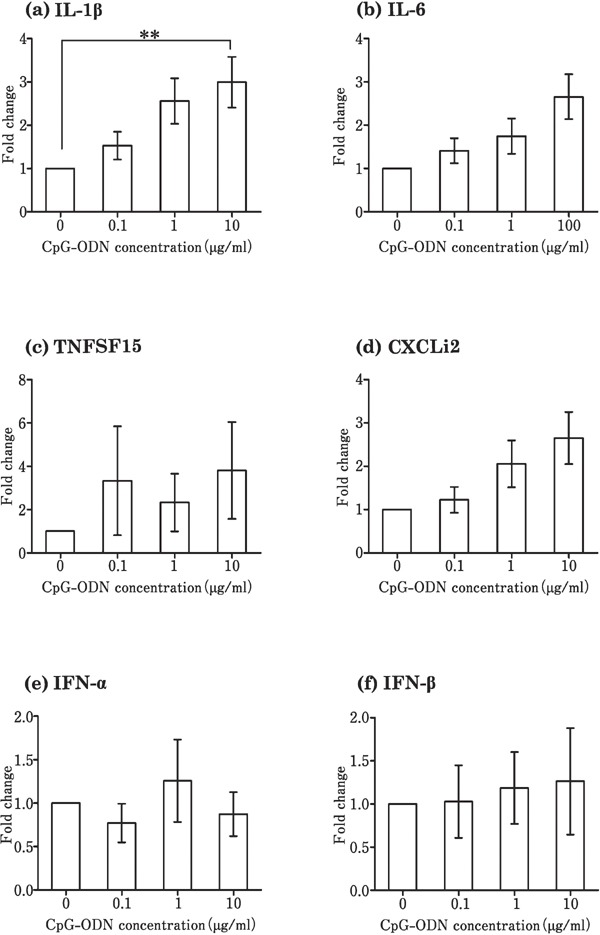
Fig. 5.

Changes in the expression of cytokines in cultured follicular theca from laying hens in response to CpG-ODN stimulation. Cultured tissues were stimulated with 0–10 µg/mL CpG-ODN. Values are the mean±SEM (n=7). Asterisks indicate significant differences (** P<0.01).
