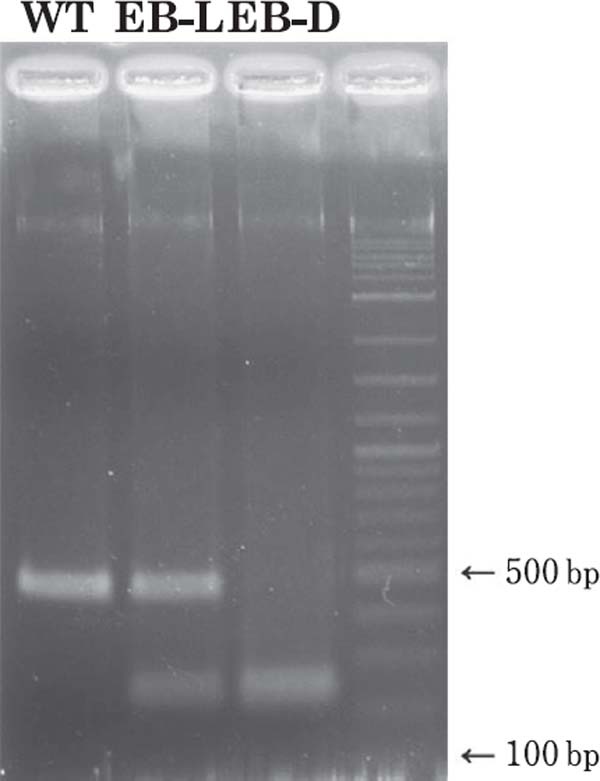
Fig. 3.

PCR-RFLP analysis of the MC1R gene of the blue-breasted quail. WT=wild type, EB-L=extended brown-light, and EB-D=extended brown-dark. The 462-bp amplicon around the c.274Ggt;A substitution in MC1R was digested with the restriction enzyme MscI. WT had only one non-cleaved band of 462 bp. EB-L produced three bands of 462, 237, and 225 bps, while EB-D had two bands of 237 and 225 bps. In the photo, the bands of 225 and 237 bps are merged because of similar amplicon sizes. Despite the merged bands, WT, EB-L, and EB-D are clearly and easily distinguishable from each other by PCR-RFLP.
