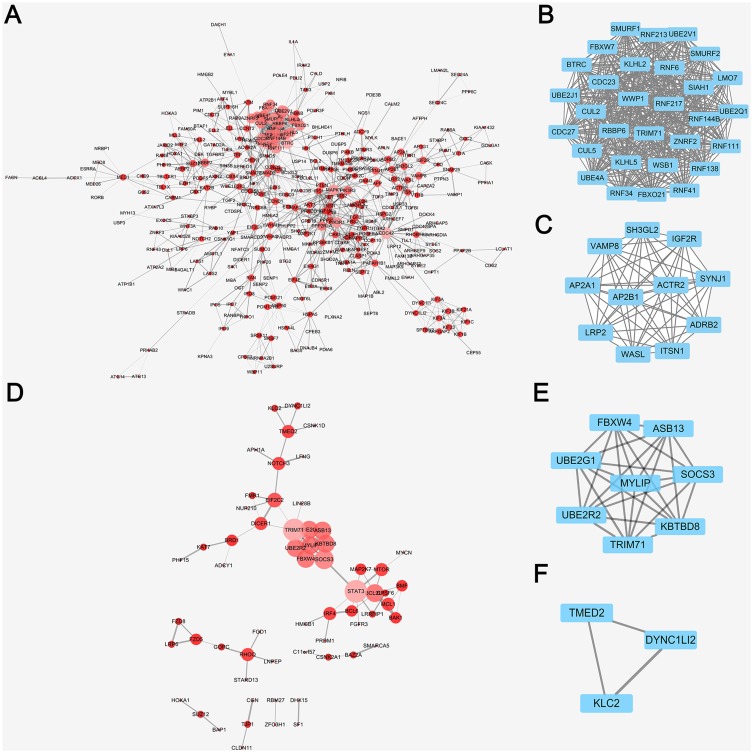
Figure 4.
PPI network analysis by cytoscape of DE-miRNAs in downregulated and upregulated group. (A) PPI network analysis of all the target genes from the downregulated DE-miRNAs, the node size and color represent the degree of target genes (low value to small sizes and dark colors). (B) The top one tetwork complex analysis of target genes from the downregulated DE-miRNAs by MCODE, which included 30 nodes and 435 edges. (C) The top two network complex analysis of target genes from the downregulated DEmiRNAs by MCODE, which included 11 nodes and 55 edges. (D) PPI network analysis of all the target genes from the upregulated DE-miRNAs, the node size and color represent the degree of target genes (low value to small sizes and dark colors). (E) The top one network complex analysis of target genes from the downregulated DE-miRNAs by MCODE, which included 8 nodes and 28 edges. (F) The top two network complex analysis of target genes from the downregulated DE-miRNAs by MCODE, which included 3 nodes and 3 edges.

