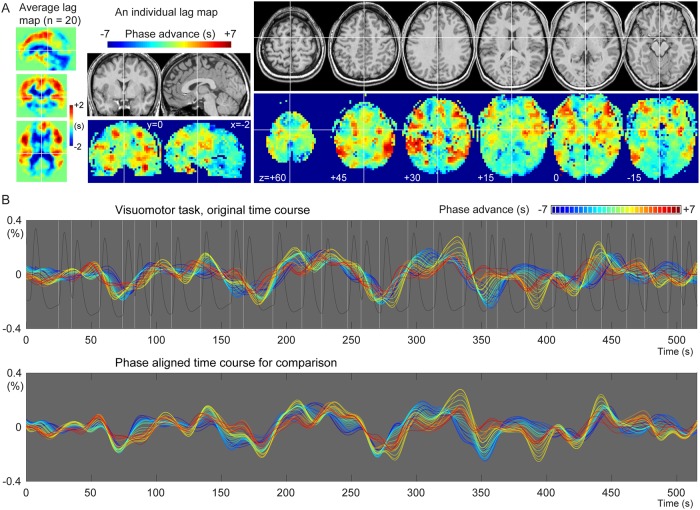
Fig 2. Representative spatial and temporal profiles of the BOLD lag structure.
(A) A lag map created by tracking the BOLD sLFO phase up to 7 s toward both up- and downstream is shown. The group average map shows the gross vascular anatomy with the early phase (positive values) distributed in the middle cerebral artery territories. The individual map provides more detailed information. (B) Seed time courses updated at each step (0.5 s) of the recursive lag tracking procedure, representing the temporal aspect of the lag structure, are shown. The warm-colored traces with advanced phases originate from the voxels with the same colors in the lag map, corresponding to the inlet or arterial side of the vasculature. A gradual change in the temporal profile is noted on top of the slow component, which is stable across regions. The white vertical lines indicate the timing of the visuomotor task, whose NVC was modeled by the hemodynamic response function (dark gray trace). The detected LFO was poorly correlated with the task-related fluctuation of neuronal origin (see main text). BOLD, blood oxygen level-dependent; NVC, neurovascular coupling.

