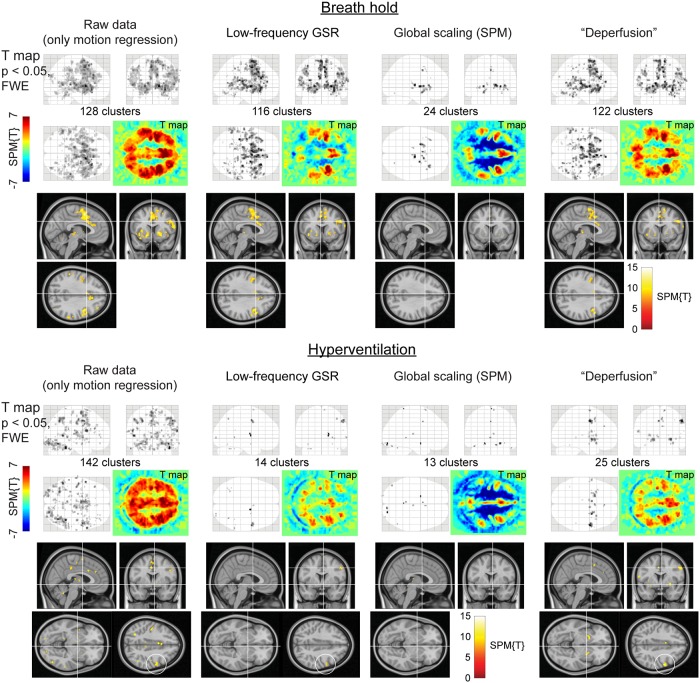
Fig 6. SPM results of the respiratory challenges.
Color panels show un-thresholded t map slices at the height of the laryngeal motor cortex (z = 35), revealing spurious negative responses (cool colors) after global signal removal but not after the deperfusioning procedure. In the hyperventilation condition, the “deperfusioned” data revealed clusters in the bilateral putamen and premotor cortex (white circle), consistently with the findings of earlier reports. FWE, family-wise error corrected; GSR, global signal regression; GS, global scaling; SPM, SPM12 software.

