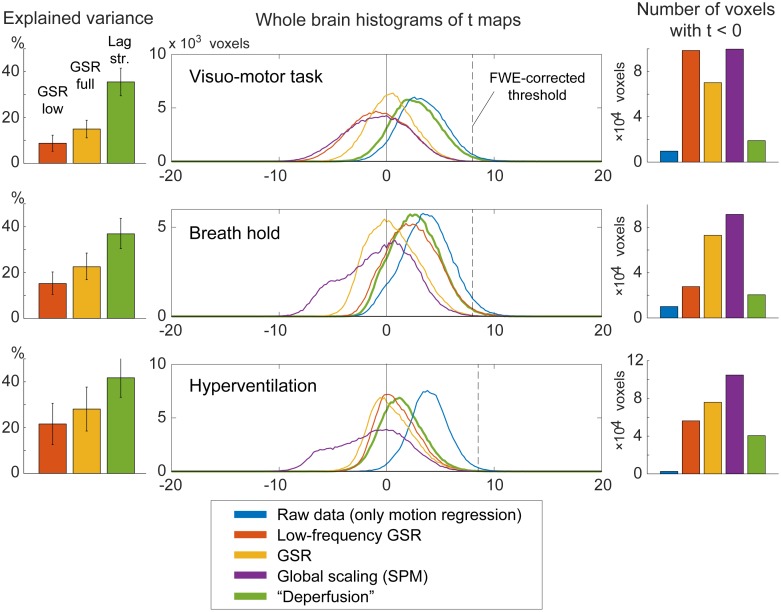
Fig 7. The effects of preprocessing on group SPM analyses.
Removal of the lag structure or deperfusioning resulted in the greatest reduction of the signal variance under all 3 tasks (left panels). Nevertheless, the spurious negative task responses were attenuated in comparison to the removal of global fluctuation (middle and right panels). Error bars indicate the standard deviation. The vertical broken line in the histogram indicates the statistical height threshold of p = 0.05, corrected for multiple comparisons by the family-wise error (FWE) rate. GSR, global signal regression; SPM, SPM12 software.

