
Figure 1.
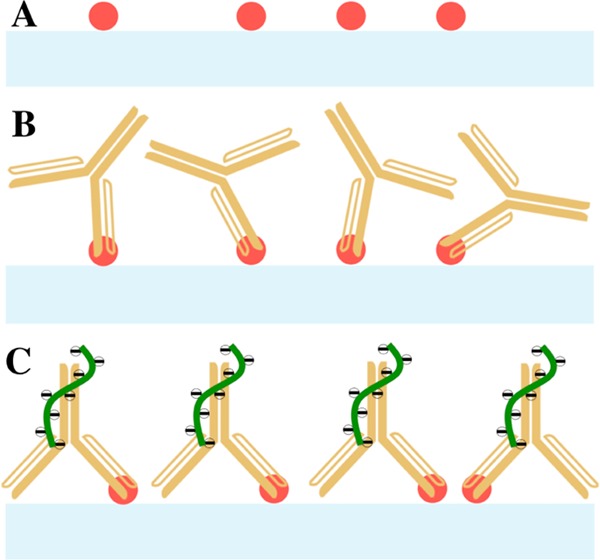
Schematic diagram of the direct immunoassay performed on the SiNW-FET biosensor in this study: (A) 6×-histidine (red dots) was immobilized on the nanowire channel (light blue bar) before transporting (B) its respective rabbit IgG (yellow Y shapes) for immunoassay and (C) R18 RNA aptamer (green curves) for signal enhancement.