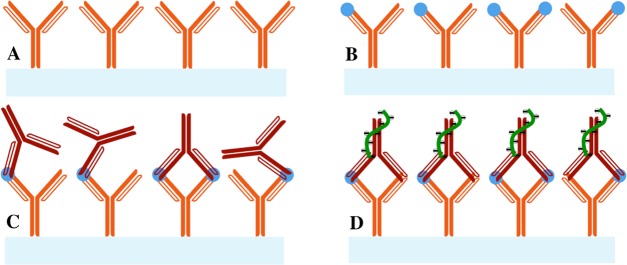
Figure 2.
Schematic diagram of the sandwich immunoassay performed on the SiNW-FET biosensor in this study: (A) mouse IgG1 (orange Y shapes) was immobilized on the nanowire channel (light blue bar) to detect (B) Aβ 1–42 peptide (blue dots) through its amino acids 1–17. The immunosensors were then exposed to (C) rabbit IgG (red Y shapes), which reacts with amino acids 33–42 of Aβ 1–42 peptide, followed by (D) R18 RNA aptamer (green curves) for signal enhancement.

