Figure 4.
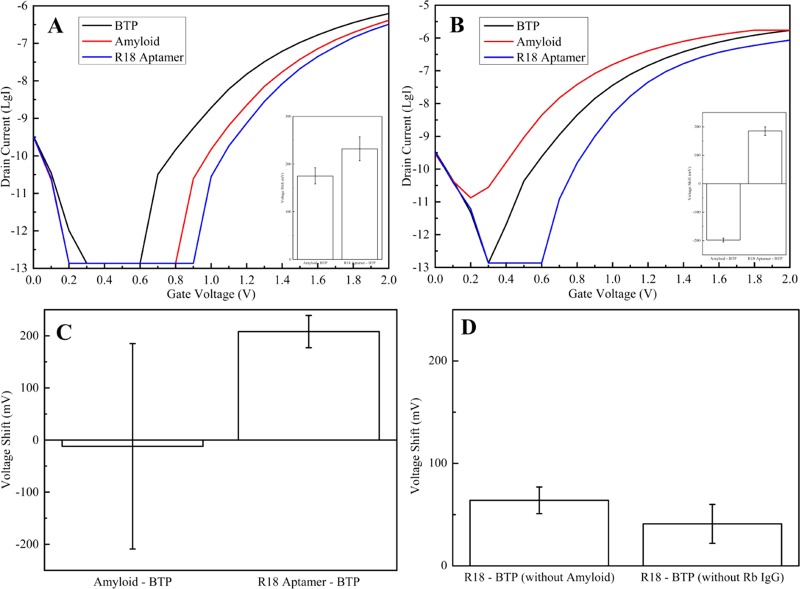
Electrical signals of the SiNW-FET chip immobilized with mouse anti-Aβ1-42 antibody (IgG1) after exposing it to 150 mM BTP (black curve) and 1 μg/mL Aβ 1–42 in 150 mM BTP buffer (red curve), followed by 1 μg/mL rabbit anti-Aβ1-42 antibody (IgG) and ∼3 μg/mL R18 RNA in 150 mM BTP buffer (blue curve). The conductance significantly reduces with the presence of R18, although it can decrease (A) or increase (B) after detecting Aβ 1–42 peptide. Insets are their corresponding statistical data as ΔV = mean ± standard deviation (n = 5) after recognizing Aβ 1–42 (ΔVAβ-BTP) and R18 RNA (ΔVR18-BTP) (A: ΔVAβ-BTP = 175 ± 17 mV, ΔVR18-BTP = 232 ± 25 mV; B: ΔVAβ-BTP = −198 ± 7 mV, ΔVR18-BTP = 185 ± 15 mV). Total statistical data for signal amplification of this sandwich immunoassay by the aptamer (C, n = 10: ΔVAβ-BTP = −12 ± 197 mV, ΔVR18-BTP = 208 ± 31 mV) and its control experiments (D, n = 5) after injecting R18 without incubation of either Aβ 1–42 (ΔVR18-BTP = 64 ± 13 mV) or rabbit anti-Aβ1-42 IgG (ΔVR18-BTP = 41 ± 19 mV).

