
Fig 6.
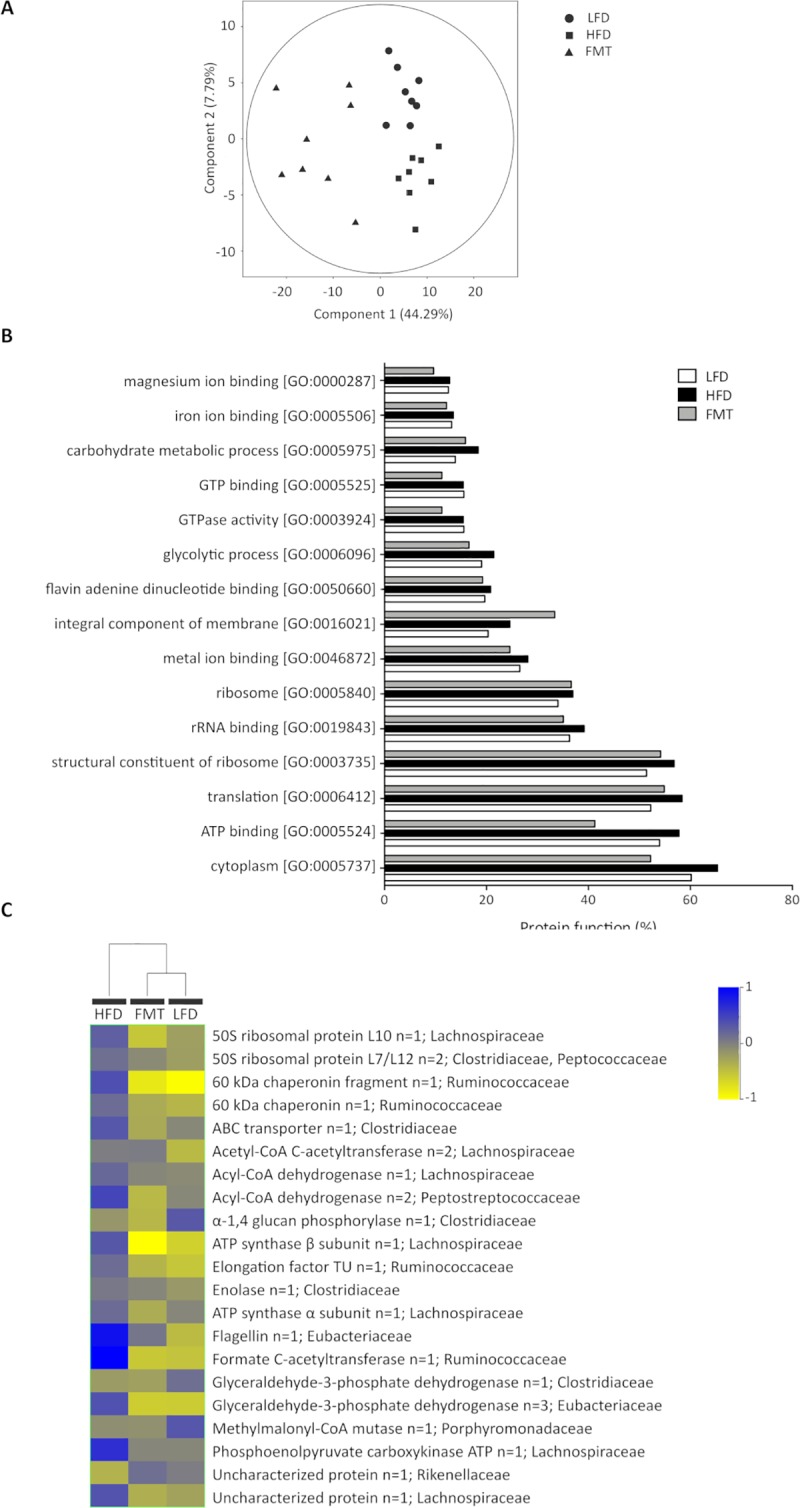
A) PCA of up- and downregulated proteins showing the separation between the three groups. The first two components are shown along with the percentages of variance that they explain. The points correspond to individual samples. B) Percentages of proteins that represent the 15 most abundant protein functions according to Gene Ontology (GO) terms in the LFD, HFD and FMT groups. C) Hierarchical clustering analysis of 21 significant proteins in the LFD, HFD and FMT groups.