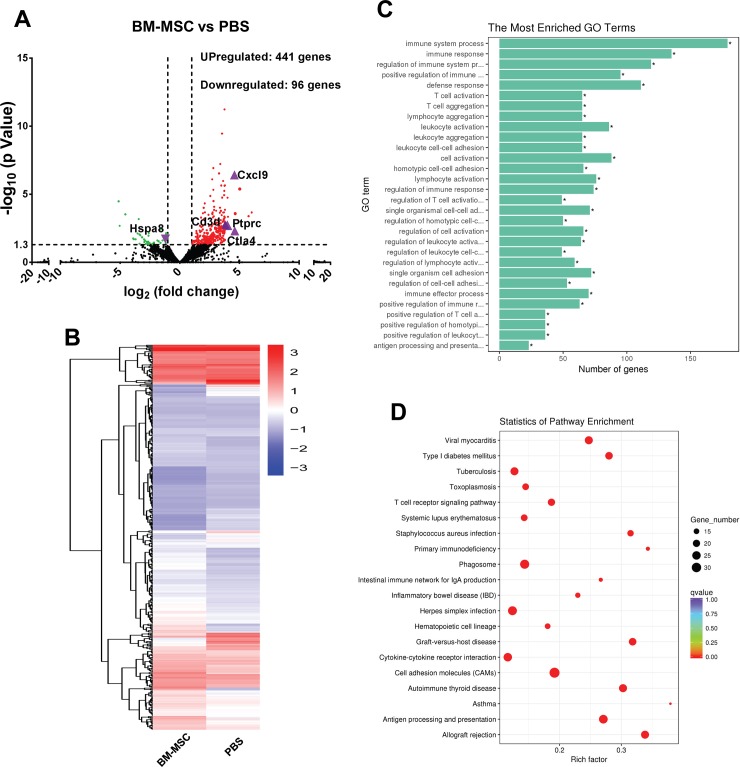
Fig 3. Comparasion of mRNA expression profiling between the corneal allografts in BM-MSC and PBS groups.
(A) A volcano plot delineating the differentially expressed mRNAs between BM-MSC and PBS groups. The red dots represented significantly upregulated mRNAs and green dots downregulated (p < 0.05 with more than two fold absolute changes). The selected genes for validating gene expression profiles were marked by purple triangles. (B) Hierarchical clustering of mRNAs in PBS and BM-MSC groups (n = 3 / group). (C) GO analysis of the differentially expressed mRNAs. (D) The top 20 KEGG pathways for the differentially expressed mRNAs. GO, Gene Ontology; KEGG, Kyoto Encyclopedia of Genes and Genomes.

