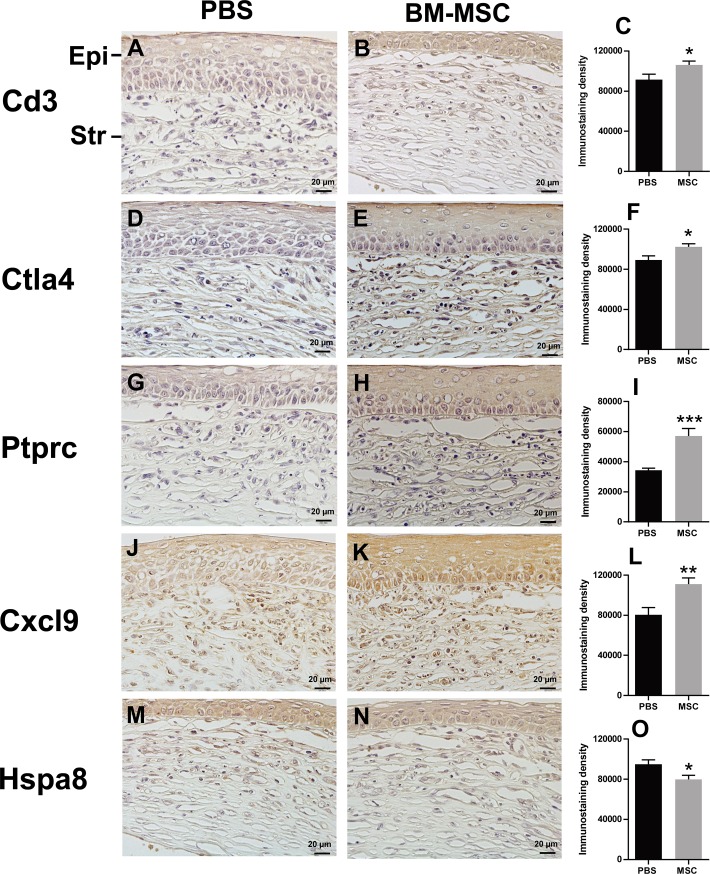
Fig 5. Validation of the gene expression at protein levels.
Representative pictures of IHC staining and quantification of staining intensity of Cd3 (A-C), Ctla4 (D-F), Ptprc (G-I), Cxcl9 (J-L), and Hspa8 (M-O) in corneal allografts were shown. n = 6 / group. *p < 0.05, **p < 0.01, ***p < 0.001. Epi: epithelium, Str: stroma; Scale bar = 20 μm.

