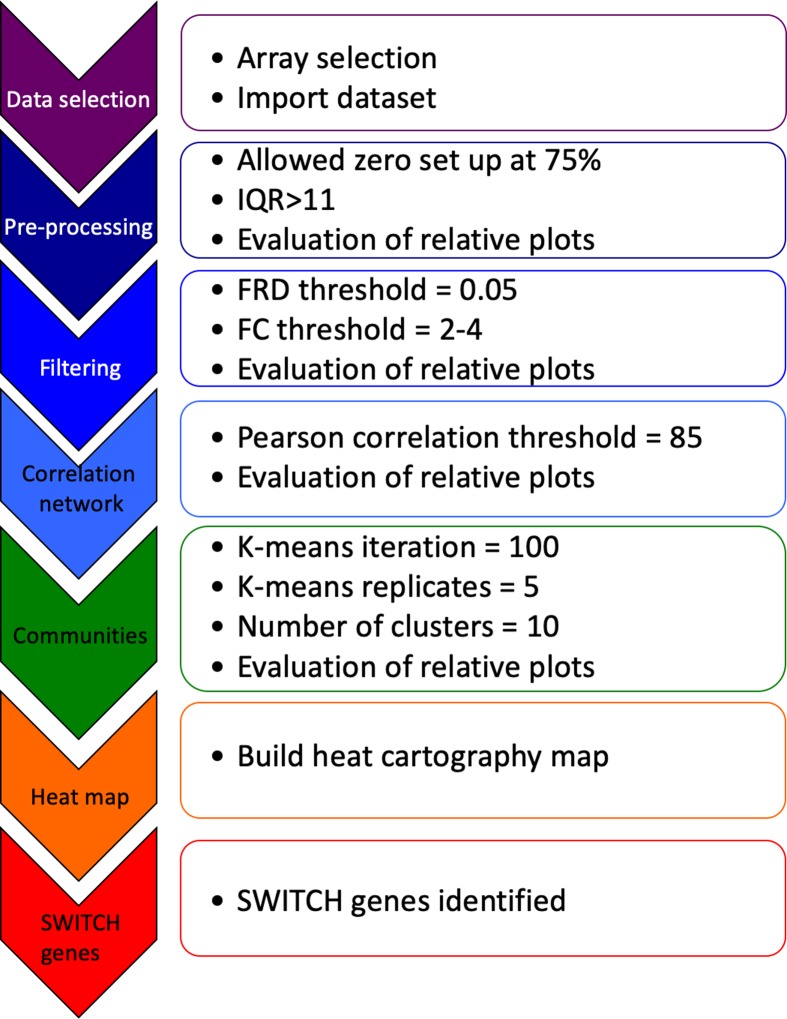
Fig 2. SWIM analysis to identify switch genes.
Data from the expression arrays was imported into SWIM. The SWIM algorithm is comprised of the steps depicted in the figure [31]. For each brain section and each group, diseased and normal, the mean value of the gene expression is calculated for every cell in the microarray. The p-value is then calculated for each gene. Control for the false discovery rate is performed using the Benjamini and Hochberg approach. The sets of genes to analyze is further filtered by setting thresholds for the magnitude of the fold change and false discovery rate. Next, the Pearson correlation coefficient is calculated for the remaining pairs of genes and those below a threshold are eliminated. At this point 1000 to 2000 genes out of the original 54675 remain. These genes become the nodes in the network that will be analyzed.

