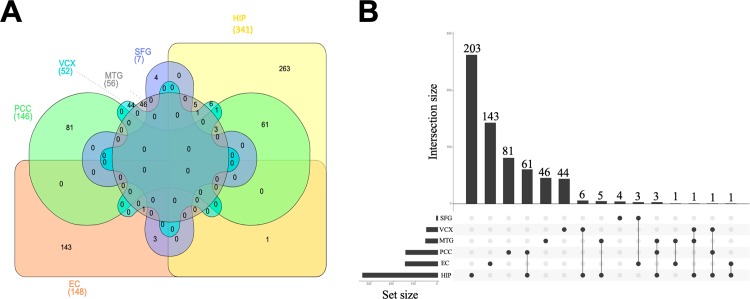
Fig 9. Venn diagram and UpsetR plot of switch genes from different brain regions.
A. The Venn diagram was created using http://www.interactivenn.net/. The genes symbols were imported for the different brain areas. EC: Entorhino cortex, HIP: Hippocampus, MTG: Mid Temporal Gyrus, SFG: Superior Frontal Gyrus, PCC Posterior Cingulate, VCX: Primary Visual Cortex. B. The UpSetR plot was created as described [37]. The horizontal bars with labels at the lower left of the panel represent the six data sets that were included in the Venn diagram, with the length of each bar displaying the total set size. The dot pattern to the right shows the intersections between the sets. The vertical bars at the top show the size of the corresponding intersection, ranked by decreasing set size, where a gray dot indicates an empty set and a single black dot indicates no intersection with another set.

