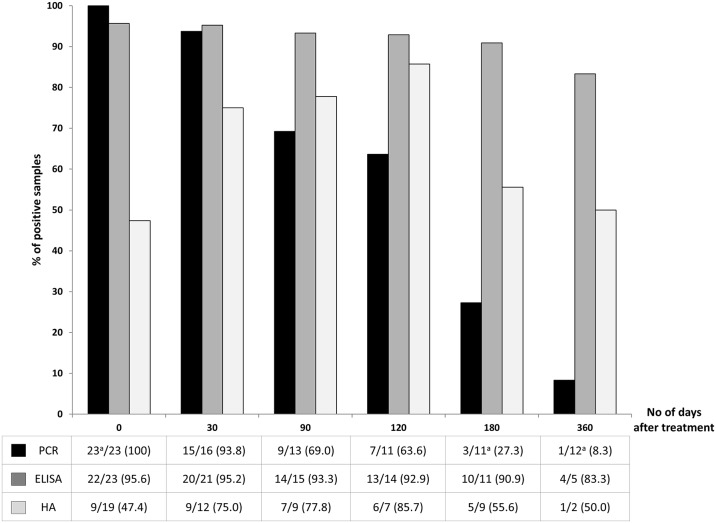
Fig 2. Kinetic of serum PCR, ELISA and HA positivity rates after treatment (n = 23 patients).
Bars represent the percentage of positive samples which remained positive at different times post-treatment. The table presents the number of positive sera/number of analyzed sera, at each time (n/N (%)). aOne serum was positive for both Sm and ShPCR at diagnosis.

