Figure 10.
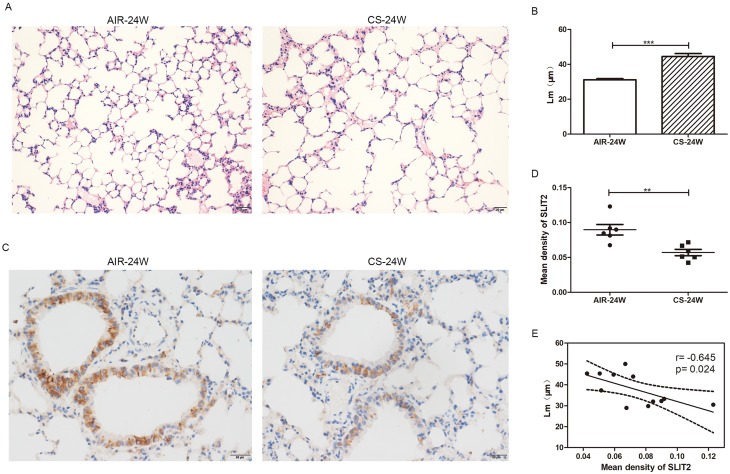
The mean linear intercept (Lm) and immunohistochemistry staining of SLIT2 in lung of AIR-exposed and CS-exposed mice.
Notes: Representative photomicrographs of hematoxylin and eosin stained lung tissue of 24 weeks AIR-exposed and CS-exposed mice, magnification ×20 (A) The Lm of alveolar in 24 weeks AIR-exposed and CS-exposed mice (B) The photomicrographs for immunohistochemistry staining of SLIT2 in lung of AIR-exposed and CS-exposed mice, magnification ×40 (C) The mean density value of SLIT2 staining in the lung of AIR-exposed and CS-exposed mice (D) Scatter plot of correlation analysis for mean density of SLIT2 staining and Lm in lung of mice (E) AIR-24W represents mice exposed to air for 24 weeks, and CS-24w represents mice exposed to CS for 24 weeks. **p<0.01, ***p<0.001.
Abbreviations: Lm, the mean linear intercept; CS, cigarette smoke; SLIT2, slit guidance ligand 2.

