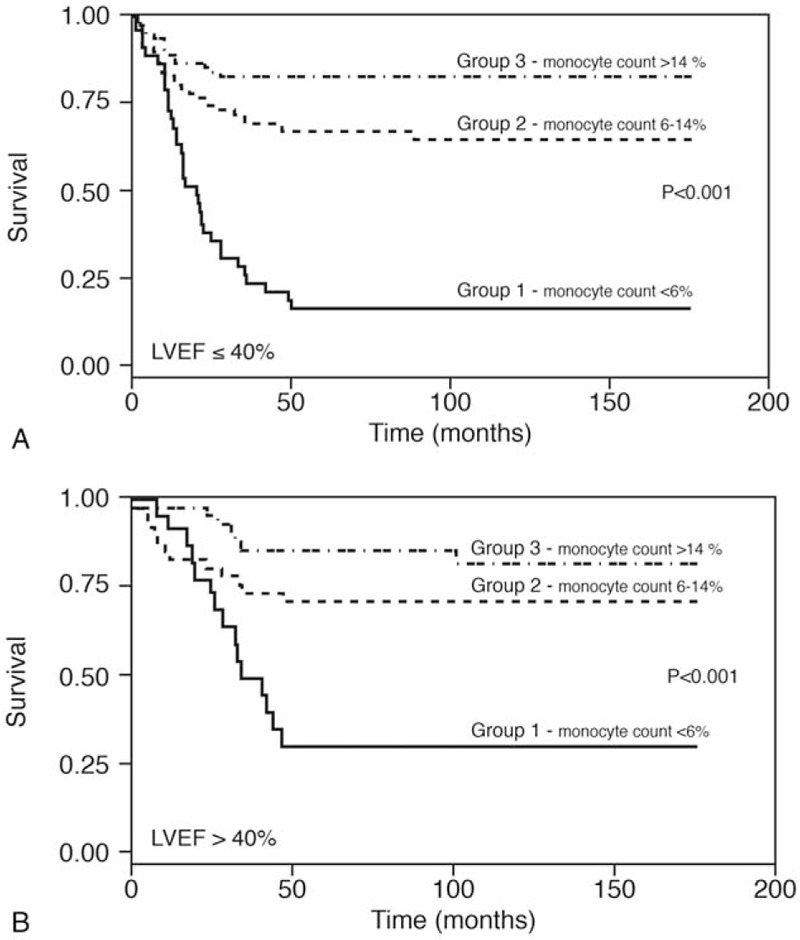
Figure 2.

A. Kaplan–Meier survival curves of the 3 monocyte groups, among patients with ejection fraction ≤40%. B. Kaplan–Meier survival curves of the 3 monocyte groups among patients with ejection fraction >40%.

A. Kaplan–Meier survival curves of the 3 monocyte groups, among patients with ejection fraction ≤40%. B. Kaplan–Meier survival curves of the 3 monocyte groups among patients with ejection fraction >40%.