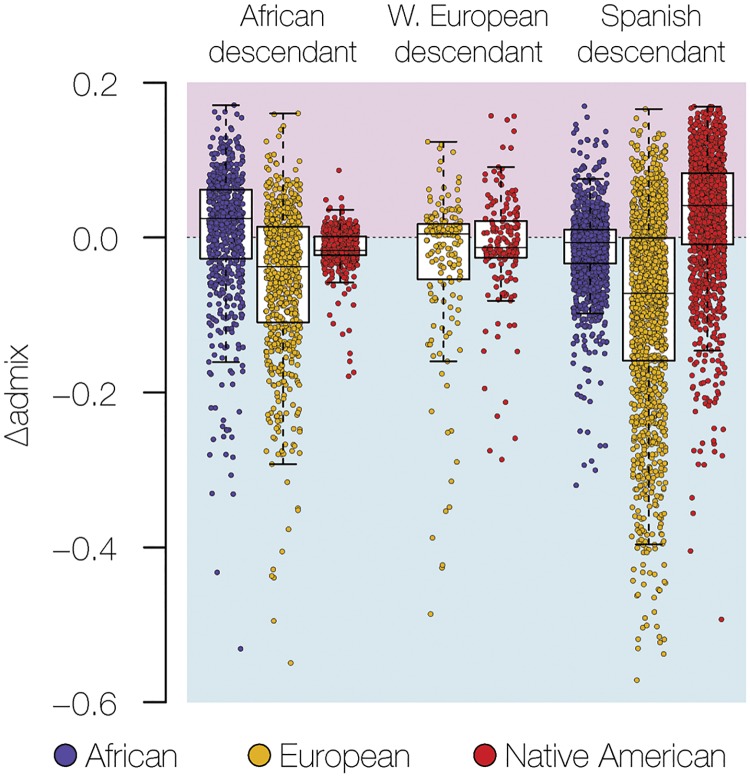
Fig 2. Sex-biased admixture in US genetic ancestry groups.
Normalized differences between X chromosome ancestry fractions and autosomal ancestry fractions (ΔAdmix) are shown on the y-axis. ΔAdmix values are shown for each ancestry component–African (blue), European (gold), and Native American (red)–in each individual genome. ΔAdmix values above zero (pink) indicate female-biased admixture, and values below zero (blue) indicate male-biased admixture.

