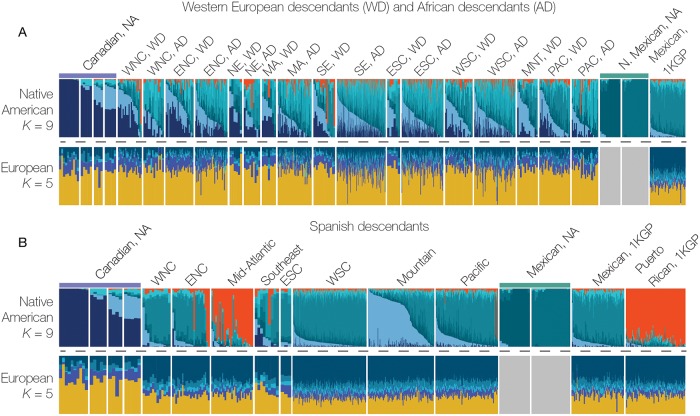
Fig 4. Native American and European ancestry profiles for US ancestry groups.
Native American (K = 9) and European (K = 5) ancestry-specific ADMXITURE plots are shown for the Western European descendant (WD) and African descendant (AD) groups combined (A) and for the Spanish descendant group (B). The individual panels shown correspond to Native American (NA) reference populations, 1000 Genomes Project reference populations and the HRS data from the different US census regions (S1 Fig).

