
Figure 2.
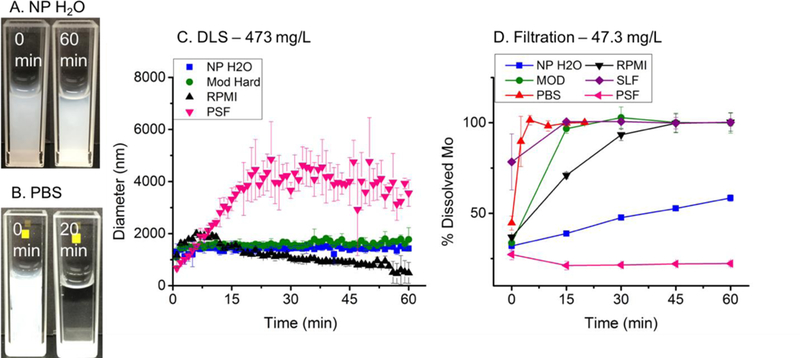
Aggregation and dissolution studies of MoO3 nanoribbons. A-B. Optical imaging in NP (A) and PBS (B) showing contrasting behavior. DLS monitoring in four fluid media at nanoribbon starting concentration of 473 mg L−1 (C). Note that dissolution in PBS and SLF were too fast to obtain good DLS data. ICP-AES measurements of soluble molybdenum after ultrafiltration in six media at starting nanoribbon loading of 47.3 mg L−1 (D). N=3 for all data points.