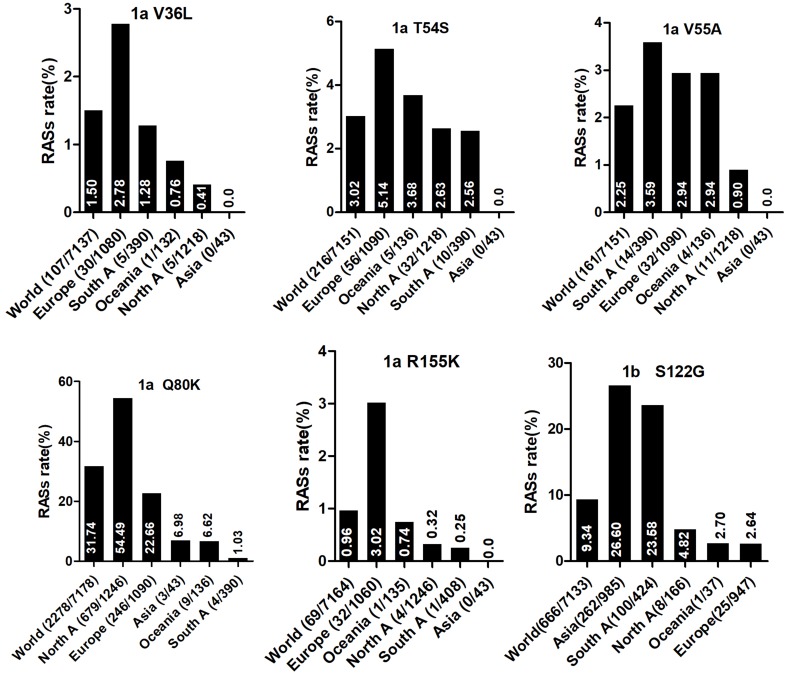
Figure 1.
The global and regional frequency of naturally occurring NS3 RASs that showed unequal distribution by geographic regions. In each plot, except for the first bar representing the global prevalence, geographic regions were arranged in descending order according to the frequency of RASs. Sequences were clustered into Asia, Europe, North America, Central America, South America, Former USSR, Oceania, Africa, Caribbean or Middle East. In each plot, regions with <10 sequences were not shown. Region definition was according to the Los Alamos HCV Database. “A” in North A, South A and Central A denotes America.

