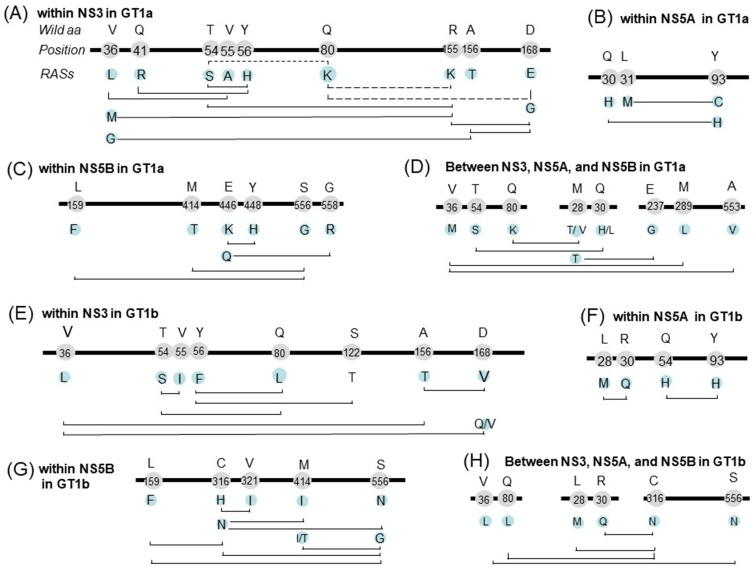
Figure 4.
Co-occurring and mutually exclusive RAS pairs within NS3 (A), NS5A (B) and NS5B (C) and among regions (D) in GT1a; within NS3 (E), NS5A (F) and NS5B (G) and among regions (H) in GT-1b. Bold line represents HCV genome, the figures on the line indicate the location of amino acid, the characters above the location indicate the wild type amino acids, and the characters below the location indicate RASs. The solid, and dashed line connecting two RASs indicate co-occurring RAS pairs (significantly more frequent appearance than expected) and mutually exclusive RAS pairs (significantly infrequent occurrence than expected), respectively. Amino acid residue position is numbered relative to the first amino acid of the NS3, NS5A, or NS5B region.

