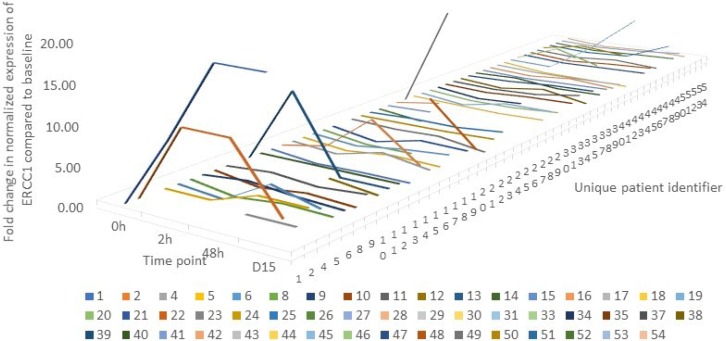
Figure 3. A line graph depicting the pattern of change in ERCC1 expression over time in each individual patient (n=50) where mRNA expression was quantified by qPCR.
The graph is censored at 20 to allow for graphical representation. The lowest expression was seen in patient 21 at 2 hours where ERCC1 level was suppressed to 2% of baseline levels. Contrarily, the highest expression was in patient 1 at 48 hours, where ERCC1 level was 400% of baseline.

