Figure 3.
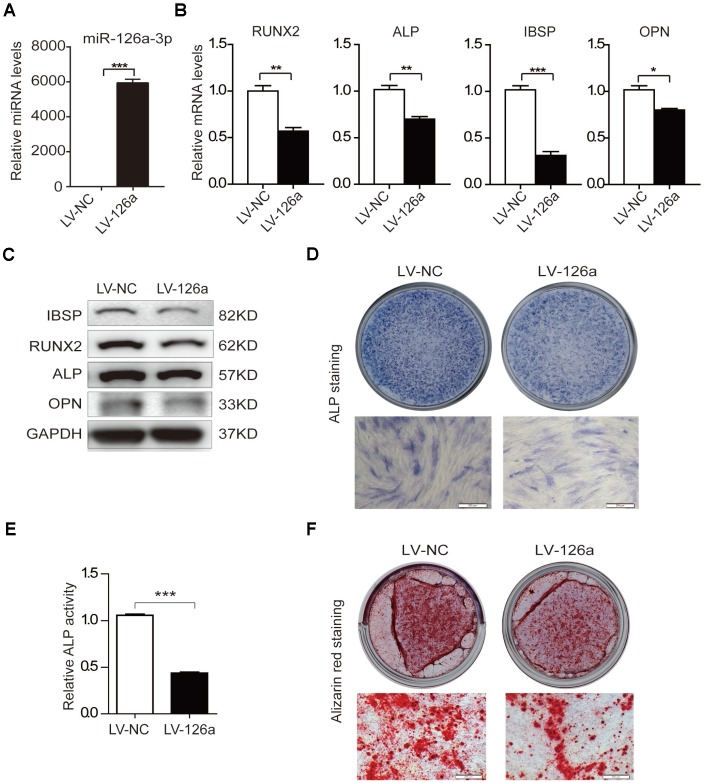
Osteogenesis is suppressed upon upregulation of miR-126a-3p in hADSCs. (A) The expression level of miR-126a-3p was detected using qRT-PCR in transduced hADSCs with lentivirus overexpressing miR-126a-3p (LV-126a) or the negative control (LV-NC). (B) The mRNA levels of osteogenic-related genes were detected by qRT-PCR assay in osteogenic-induced cells on day 6. (C) Western blot assays analyzed the protein levels osteogenic-related genes in osteogenic-induced cells. (D, E) ALP staining and ALP activity analyses indicated early differentiation on day 6 of osteogenic differentiation. (F) Alizarin red staining was performed to detect calcium salt deposits on day 12. Scale bars: 200 μm. Quantitative data are presented as the mean ± S.D. (n =3). *P<0.05; **P<0.01; ***P<0.001.

