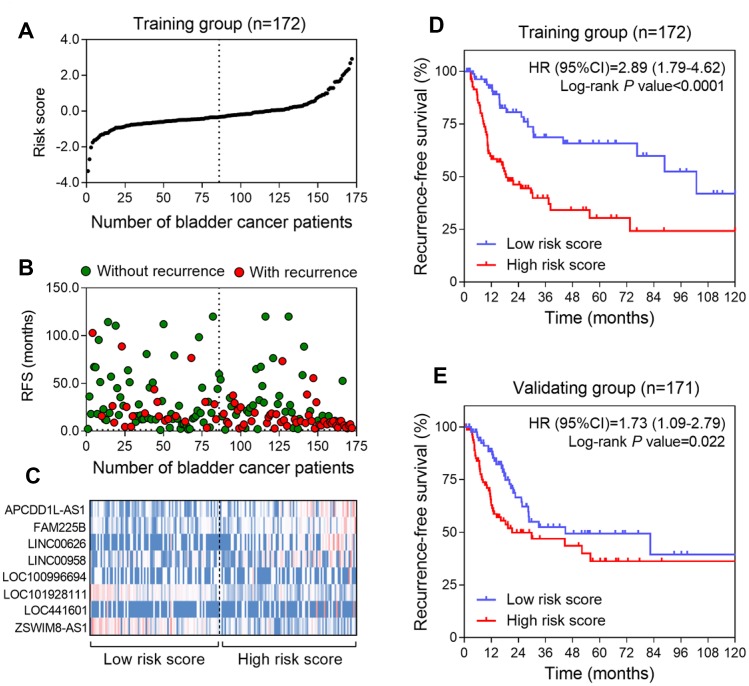
Figure 1.
Construction of the eight-lncRNA risk model of BLCA. (A) lncRNA signature risk score distribution in the training group. (B) BLCA patients’ survival status in the training group. (C) Heatmap of the lncRNA expression profiles. Rows represent lncRNAs, and columns represent patients. The black dotted line represents the median lncRNA risk score cutoff dividing patients into low-risk and high-risk groups. Red: high expression; Blue: low expression. (D and E) Kaplan-Meier analysis for the recurrence free survival of BLCA patients in training series (D) and in validating series (E).

