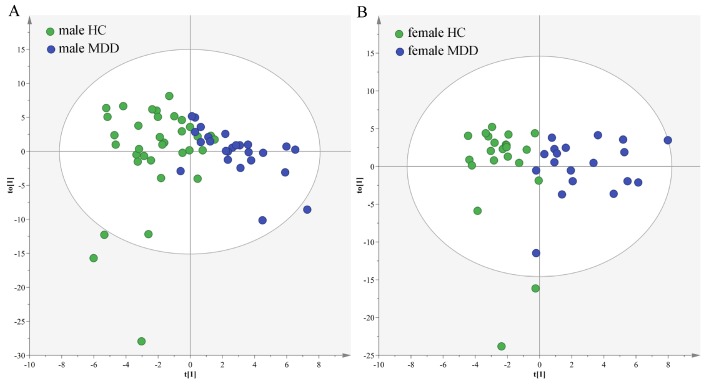
Figure 6.
Sex-specific urinary differences in young populations. (A) OPLS-DA model showed an obvious separation between male HCs (green circle) and male MDD patients (blue circle); (B) OPLS-DA model showed an obvious separation between female HCs (green circle) and female MDD patients (blue circle).

