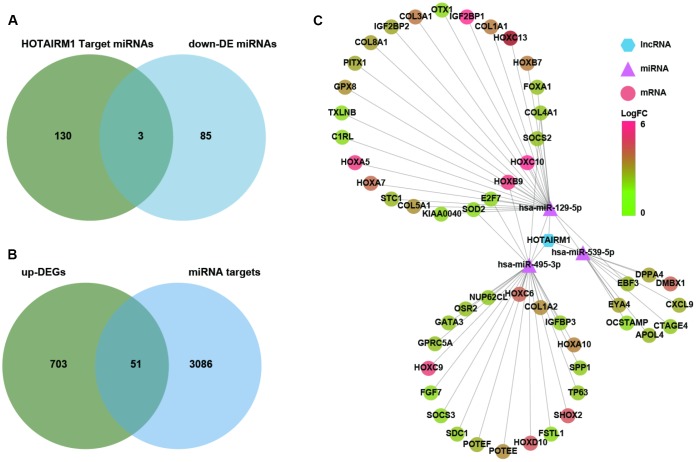
Figure 6.
Construction of a HOTAIRM1–miRNA–mRNA network. (A) Venn diagram showing the intersection between HOTAIRM1 target miRNAs predicted with DIANA tools and LncBase Predicted v.2 and miRNAs that are differentially downregulated in GBM compared with normal brain tissue (P < 0.01). (B) Venn diagram showing the intersection between up-DEGs in the high-exp group compared with the low-exp group (log2 fold change > 2; P < 0.05) and predicted targets of three miRNAs (hsa-miR-129-5p, hsa-miR-495-3p, and hsa-miR-539-5p). (C) Network comprising HOTAIRM1, three miRNAs, and 51 genes generated with Cytoscape v.3.6.1. DE, differential expression.

