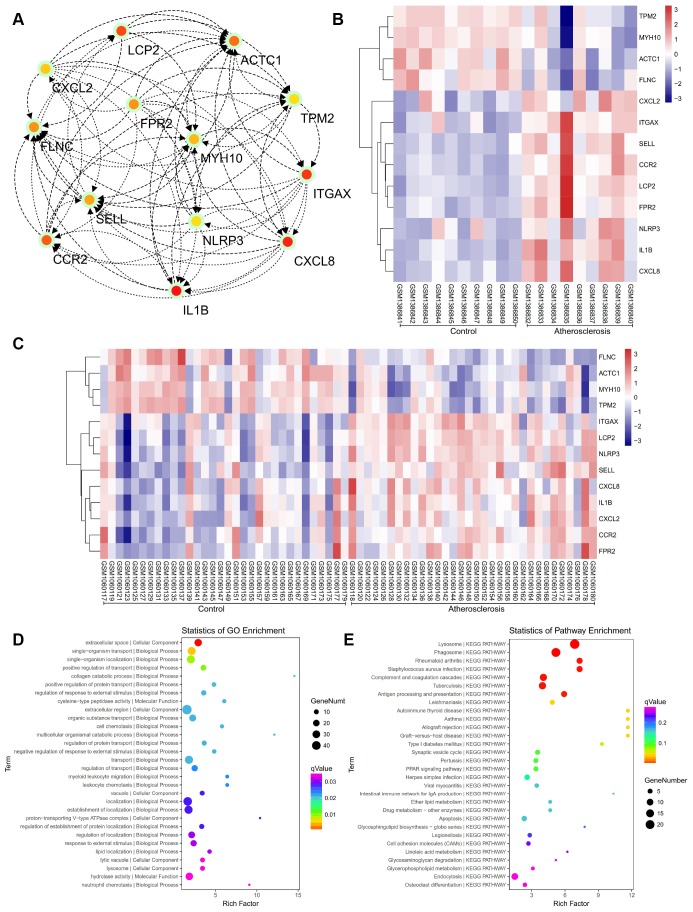
Figure 5.
(A) The hub genes were identified from the PPI network. (B, C) Hierarchical clustering demonstrated that the hub genes could effectively differentiate the atherosclerotic samples from the non-atherosclerotic samples in the GSE57691 and GSE43292 datasets. The upregulated genes are marked in pink, the downregulated genes are marked in blue. (D) The GO enrichment analyses of DEGs of our private dataset. (E) The KEGG pathway analysis of DEGs of our private dataset.

