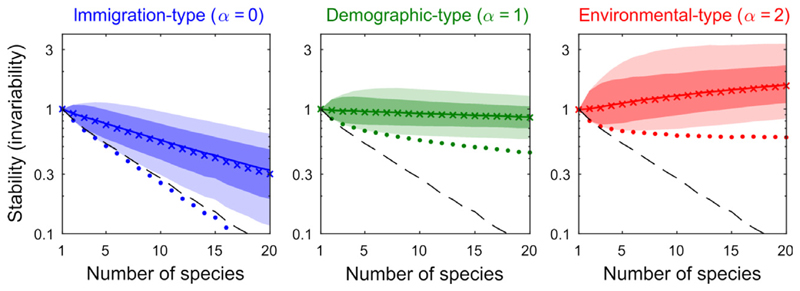
Figure 6.
Different perturbation types yield contrasting diversity–stability relationships, with stability quantified as invariability ℐ. We generated random communities of increasing species richness S and computed their invariability distribution in response to random perturbations (1000 communities per species richness; 1000 perturbations per community). Full line: median invariability, dark-shaded region: 5–95th percentile, light-shaded region: minimum to maximum realised values. The ×-marks correspond to the analytical approximation for the median, the dots to the analytical formula for the worst-case. Dashed line is asymptotic resilience ℛ∞. For immigration-type perturbations (α = 0, blue), diversity begets instability, with ℛ∞ following worst-case invariability. For demographic-type perturbations (α = 1, green), the trend is ambiguous. For environmental-type perturbations (α = 2, red), all realised values of invariability increase with S.

