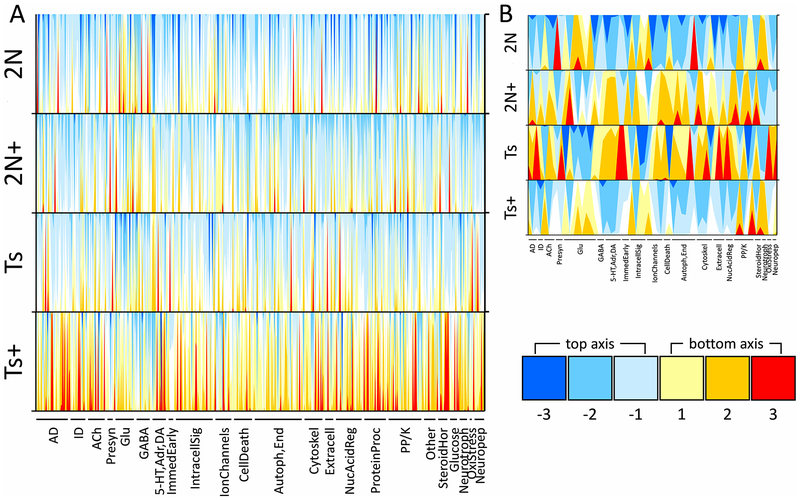
Figure1.
Horizon plots display transcription signature of MS/VDB basal forebrain cholinergic neurons from Ts65Dn (Ts) and disomic (2N) mice exposed to maternal choline supplementation (MCS, +) or normal diet from conception to weaning. A. Two-axis horizon plots show the relative expression level of all genes examined, using normalized row (gene) z-scores across the four groups. Negative values descend from the top abscissa (blues) and positive values ascend from the lower abscissa (reds and yellows) as shown in the legend at the lower right. Horizon plots stack data to provide an illustration for intensity of differences across genotype and treatment groups by overlaying fold-change surface plots and color-coding for overt determination of patterns. Each stacked surface plot (i.e. each color) represents a one-fold change, such that the lighter shades (-1 and 1 in the legend) are nearer to the mean expression which is set at 0, and darker shades descend/ascend accordingly (−2, −3 and 2, 3 in the legend). Use of two x-axes prevents overlap of negative and positive z-scores. Gene classes are listed below the 4 horizon plots and each spike can be thought of as a gene in that class (AD, Alzheimer’s disease; ID, intellectual disability; ACh, acetylcholine; Presyn, presynaptic; Glu, glutamate; GABA, gamma aminobutyric acid; 5-HT,Adr,DA, serotoninergic, adrenergic, and dopaminergic; IntracellSig, intracellular signaling; Autoph,End, autophagy and endosomal; Cytoskel, cytoskeleton; Extracell, extracellular matrix and nontransmitter inter-cellular signaling; NucAcidReg, nucleic acid regulation; ProteinProc, protein processing; PP/K, protein phosphatase and kinase; SteroidHor, steroid hormones; Neurotroph, neurotrophins; OxiStress, oxidative stress; Neuropep, neuropeptides). B. The horizon plot that results when only the genes with significant genotype differences in normal diet conditions (2N × Ts) as well as significant alteration with MCS in Ts mice (Ts+ × Ts) is shown (p < 0.01 using mixed effects model with false discovery rate based on null distribution; 10 mice per group). As opposed to the overall expression differences shown in A, the plots in B shows a clear expression pattern of elevated levels in Ts and 2N+ mice and lower levels in 2N and Ts+ mice, providing an overview of the genotype and treatment interaction effect in this murine model with MCS.

