Figure 2.
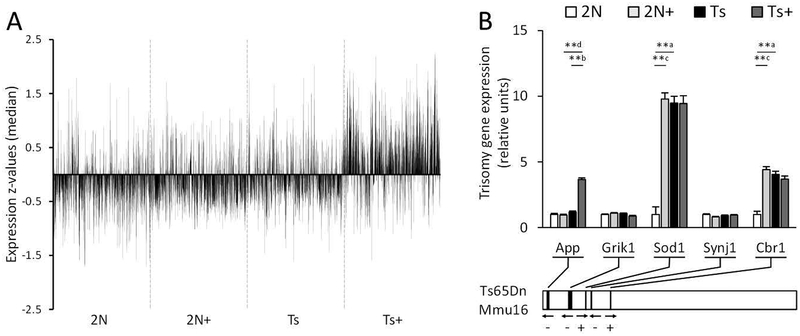
Total expression and trisomy related gene expression levels of genes on a custom-designed microarray were measured in isolated basal forebrain cholinergic neurons from the MS/VDB. A. Vertical spike plot shows median z-scores per probe from a membrane microarray analysis on cholinergic neurons in the MS/VDB of Ts65Dn mice (Ts) and disomic littermates (2N). From conception to weaning, dams and pups were exposed to either normal diet or maternal choline supplementation (+). There are clear treatment and genotype effects when transcription comparison results are examined as a whole, including an overall increase in expression of Ts+ mice genes compared to the other groups. B. Bar graph shows expression levels of five genes triplicated in the Ts65Dn mouse model. The chromosome segment underneath diagrams to-scale locations of the genes on the chromosome. ** p < 0.005 using a mixed effects model with false discovery rate based on null distribution, n = 10 mice per group; a, Ts × 2N; b, Ts+ × Ts; c, 2N+ × 2N; d, Ts+ × 2N+

