Figure 6.
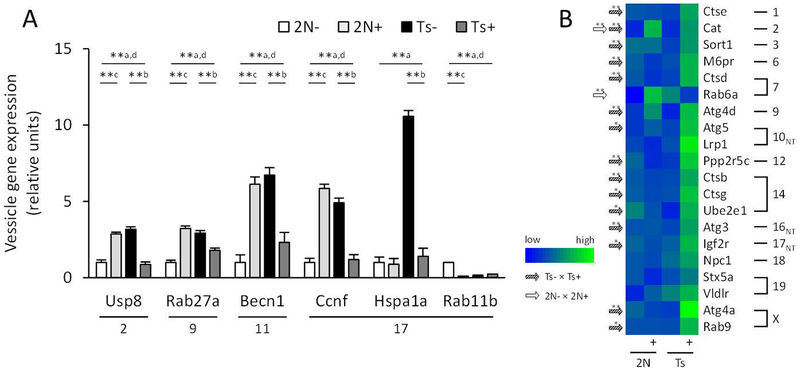
Bar graph and heatmap show significant changes in gene expression levels in basal forebrain cholinergic neurons for vesicular endosomal, exosomal, and autophagy-related genes between disomic (2N) and Ts65Dn (Ts) mice exposed to normal diet or maternal choline supplementation (+). A. Bar graph shows increased expression of five genes related to endosomes and autophagy in Ts mice compared to 2N mice and normalization with MCS. ** p < 0.005 using a mixed effects model with false discovery rate based on null distribution, n = 10 mice per group; a, Ts × 2N; b, Ts+ × Ts; c, 2N+ × 2N; d, Ts+ × 2N+ B. Heatmap of autophagy, endosome, and exosome gene expression levels shows significant changes with MCS in Ts (hatched arrows) and 2N (white arrows) mice. Lowest expression levels are in blue (Rab6a, 2N), and highest in green (Atg4a, Ts+).

